Monitoring Needs a Tap Port
Infrastructure protects itself in layers, but monitoring doesn't. Semantic monitoring reads the causal chain the way a tap port watches a network.

As I write this, Microsoft 365 is working through a long outage. Exchange Online, Outlook, Teams and Copilot are all affected. Restored servers reportedly become unresponsive again soon after they start taking traffic. I'm not going to diagnose it. I don't have the data, and the engineers on that bridge know far more than any outsider does. But it got me thinking about a question I've carried for most of my career: the infrastructure we run protects itself in layers, so why doesn't our monitoring?
Where I come from
My career started in networking: switches, and a lot of TCP. Then I egressed (pun intended) into storage, and from there up the stack into compute (Kubernetes). All three worlds taught me the same lesson from different directions. You assume components will fail, and you build the system so that a failure is survivable, recoverable and visible. In practice, that means dual links and equal-cost paths in the network, continuous data protection in storage, and replicas in Kubernetes.
The tap port
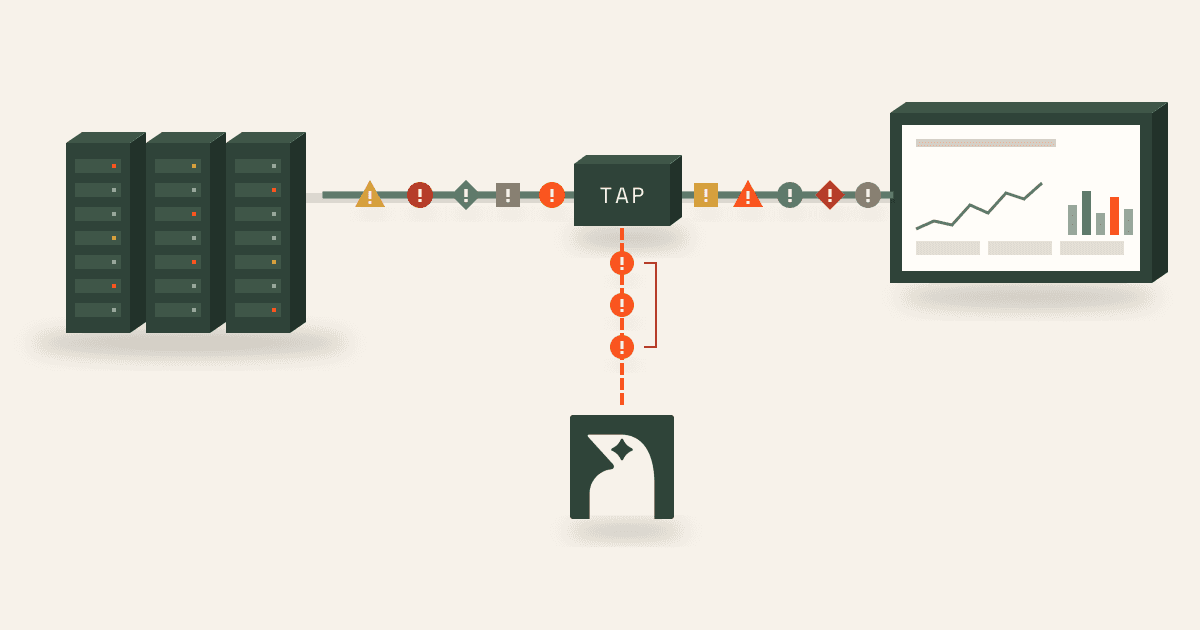
Networking also had a layer that doesn't get talked about much, and it's the one I think about most: the tap port. A tap doesn't make the network more resilient. It makes it observable. It's a passive copy of every packet, independent of the devices carrying the traffic, and it fails open, so it never takes a link down. In effect, it's redundancy for monitoring.
I spent years poring over tcpdumps. What it taught me is that a packet trace tells a story. A retransmit isn't an event on its own. It's the consequence of a full receive window, which comes from a slow reader, which comes from something upstream stalling. You learn to read causation in the sequence. No single packet is the problem. The pattern is.
That skill, reading a causal chain across signals in time order, is exactly what I find missing in how we monitor large-scale operations today.
Operations monitoring has no tap port
Today, operations runs on alerts. An alert is a threshold on a metric, or a pattern match on a log line. In storage terms, every alert is a snapshot: it tells you whether one value crossed a line at the moment it was checked, and nothing about how the system got there. In practice, three things go wrong.
Nobody really knows what the thresholds should be. Someone picked 80% CPU, or p99 latency above 500 ms, or queue depth above 1,000, years ago, for a system that has since changed shape. Set them tight and they page all night. Set them loose and they miss the real event. Most organizations end up with both at once.
So most of it becomes noise. Alerts fire, get acknowledged and get muted. Eventually the team learns which pages to ignore, which is another way of saying the monitoring has been switched off in their heads.
Every alert is independent. Health probes, request queue depth, thread pool usage, memory, client retry rates: each is watched on its own, often by a different tool owned by a different team. Nothing knows that these signals are links in the same chain. The correlation happens at 2 a.m., in the heads of the people on the bridge.
The pattern reported in today's outage is a good illustration of the kind of failure this leaves exposed. When recovered servers fail again as soon as traffic returns, it usually means several things are happening together. Clients retry, queues build, a fresh server is overwhelmed before it warms up, its health probe fails, and it's pulled out of rotation again. Each of those signals, watched alone, just looks like another alert. Together they describe a system stuck in a loop.
I want to be careful here. Hindsight is easy. Any outsider can draw a tidy causal chain after the fact, and real incidents are messier than that, with constraints nobody outside can see. My point is that our production operations has redundancy of components but no redundancy of monitoring. We have nothing like a tap port that watches the system's behavior as a whole.
Semantic monitoring, not thresholds
This is what we do at NeuBird, and we call it semantic monitoring. Instead of a threshold on a metric or a grep on a log line, you describe what a failure means: a plain-language account of how it unfolds. For example:
When client retries rise, front-end queues build, backend thread pools saturate, health probes start flapping and the load balancer pulls nodes, the remaining nodes overload and the cycle repeats.
That description is compiled into a semantic monitor. Each step becomes a check on a real signal, bound through topology to the actual services involved, with the order and timing between steps built in.
And it runs continuously, in the same sense that continuous data protection is continuous. CDP doesn't take a snapshot every so often; it journals every write, so you can rewind to any moment. A semantic monitor evaluates every signal against the chain, all the time, and records where the system is in that chain. When something goes wrong, you don't just get an alert. You can rewind to the moment the first stage began and see how each stage led to the next.
One semantic monitor watches the whole chain, not one signal
More retries feed the loop
More retries feed the loop
Watched alone, each stage is just another alert.
Because it knows the whole chain, a semantic monitor can do three things a threshold can't:
- Predict. If the first two stages are present, you can say what's likely to come next, before it arrives.
- Explain. When it fires, the alert carries the causal chain, not just the symptom.
- Act. Further along the chain, it can trigger a workflow, such as slowing the rate at which recovered servers are given traffic.
You also don't write each one by hand. You write templates, like "a stateful service behind a load balancer stuck in a retry loop", and NeuBird instantiates them wherever that pattern exists in the topology. Hundreds of templates across thousands of services quickly become hundreds of thousands of semantic monitors, all running continuously. That's the tap port for operations: an independent layer that watches behavior, not individual signals.
To run at that scale, what runs continuously has to be cheap. Many monitors share the same underlying signals, so each signal is computed once and reused by every monitor that needs it.
Closing
When the post-mortem for today's outage comes out, it will be easy to read it and say a semantic monitor would have caught it. I'll resist that. Post-mortems are easy and prediction is hard, and I don't know what this incident's signals looked like at the moment.
What I do believe is narrower. Storage learned that redundancy isn't enough without continuous data protection and backups. Networking learned that a passive, independent view of the traffic (the tap port) is worth the cost. Kubernetes made redundancy the default for compute. Operations monitoring hasn't learned its version of that lesson yet. It has redundant components and thousands of independent alerts, but nothing that watches the system's behavior as a whole and reads the chain the way an engineer reads a packet trace.
Semantic monitoring is how we approach this at NeuBird: continuous, like CDP, and independent, like a tap port. It won't solve everything. But I think redundancy in understanding deserves a place in monitoring, the same way backups have one in storage and tap ports have one in networking.