What to Monitor to Catch Regressions Before Production
The signals that catch performance and reliability regressions before they reach production, and how to instrument for early detection.

To catch regressions before production, monitor four families of signals: service-level indicators (latency, error rate, throughput, saturation) compared against a known-good baseline, change-correlated deltas tied to each deploy, dependency and integration health, and resource and cost trends that drift slowly before they break. The goal is not more dashboards. It is high-signal comparison: does this build behave measurably worse than the last one, on the metrics that map to user experience, before it fires a threshold alert in production.
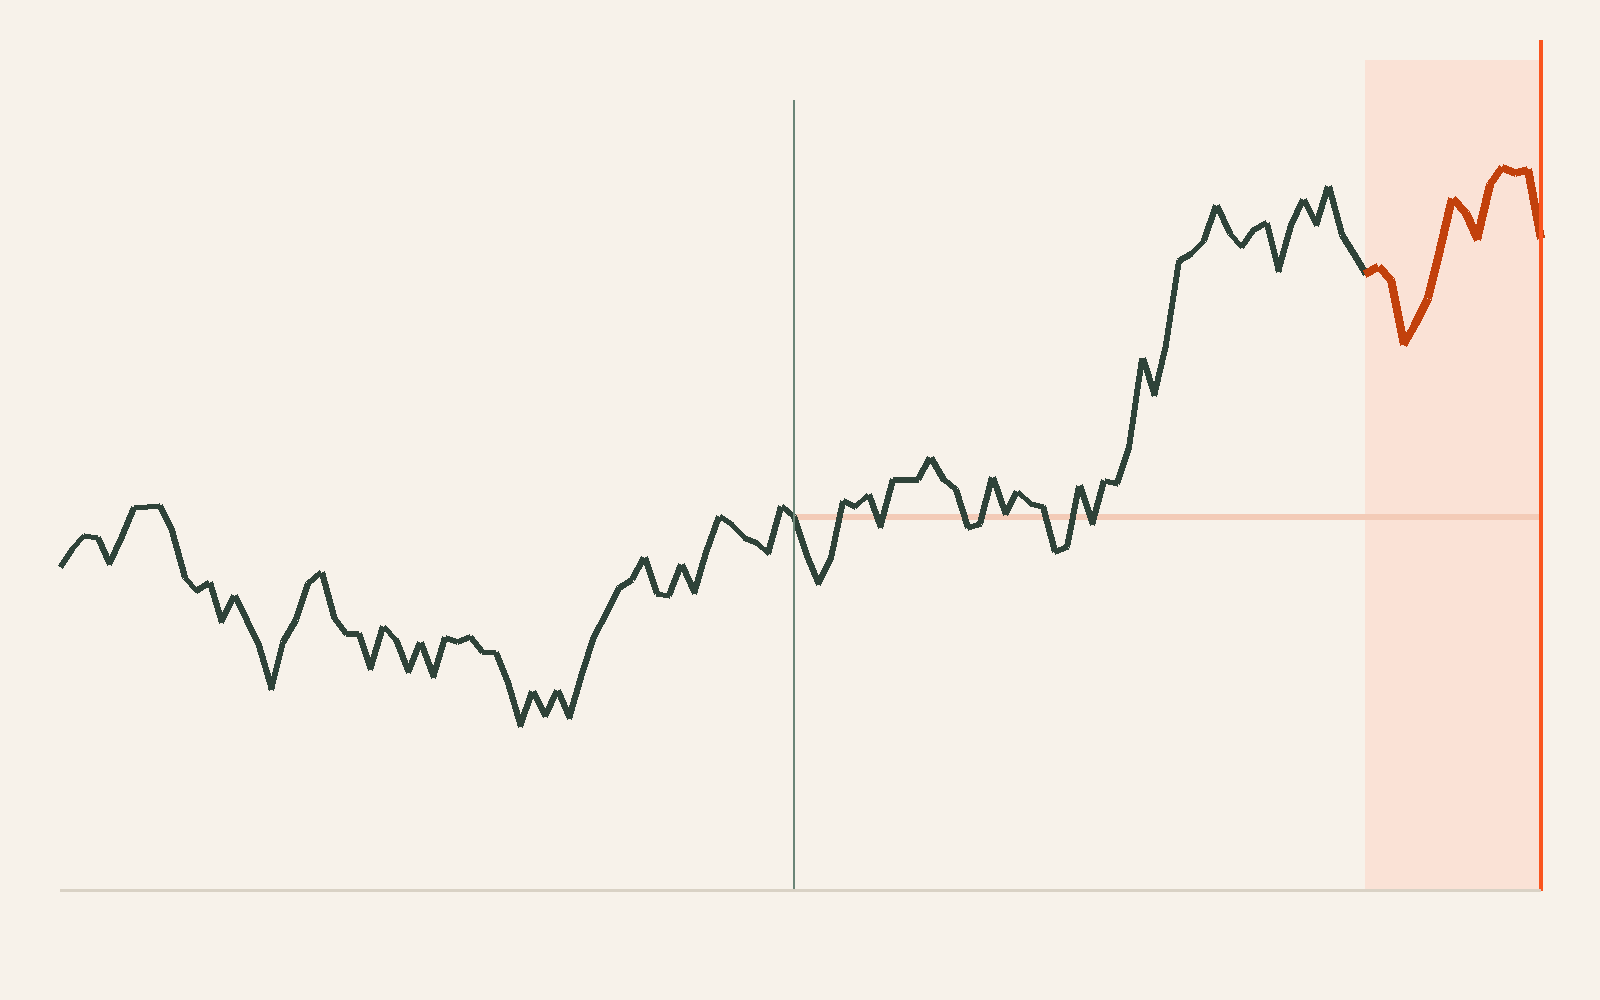
A regression is a measurable degradation relative to a prior baseline: a p99 that crept from 180ms to 240ms, an error rate that doubled under the same load, a memory footprint that grows 15% per deploy. These rarely announce themselves with a clean page. They surface as slow decay, and by the time a static threshold trips, the change is already live and customers are already feeling it. Catching them early is a question of what you compare, not how loudly you alert.
Which signals actually predict a regression?
The most predictive signals are the ones tied directly to user experience and to the specific change that shipped, measured as a delta against a baseline rather than an absolute threshold. A p99 latency of 300ms is meaningless in isolation. A p99 that jumped 40% versus the previous release, on the same traffic shape, is a regression you can act on before it pages anyone.
Instrument around business risk, not framework convention. Standard auto-instrumentation gives broad, cheap coverage based on framework defaults, but it treats every route and routine as equally important, which floods the low-value tiers with noise and leaves the tiers that dictate survival (application SLOs, payment flows, end-user experience) comparatively blind. The signals worth watching pre-production are the ones that map to what customers and revenue depend on.
The categories below cover what to monitor, why it predicts a regression, and where it belongs in the pipeline.
| Signal category | What to watch | Why it catches regressions early | Where it lives |
|---|---|---|---|
| Golden signals (SLIs) | Latency (p50/p95/p99), error rate, throughput, saturation | Direct proxies for user experience; a delta versus baseline flags degradation before customers do | CI performance gate, staging, canary |
| Change-correlated deltas | Per-deploy diffs in the metrics above, tied to commit/build | Isolates which change caused the shift; makes the regression attributable | Canary and progressive rollout |
| Dependency & integration health | External call latency, error/timeout/retry rates, broken trace context | Third-party and async boundaries are where framework defaults leave blind spots | Integration tests, staging, canary |
| Resource & cost trends | Memory growth, CPU, connection pools, query counts, token/API spend | Slow drift (leaks, N+1 queries, cost creep) precedes the outage by hours or releases | Load test, staging, production trend watch |
| Error budget burn rate | Rate of SLO consumption post-deploy | A sudden acceleration is an early, quantified regression signal | Canary and early production |
A regression is a delta, so the most useful monitoring is comparative.
If your pre-production checks emit absolute pass/fail thresholds but never compare a build against its predecessor, you will keep catching regressions in production.
Where in the pipeline should you catch each regression?
Different regressions are cheapest to catch at different stages, and the earlier a signal is comparable, the cheaper the fix. Correctness regressions belong in CI. Performance and resource regressions belong in load tests and staging with production-like traffic. Behavior-under-real-conditions regressions, the ones synthetic environments cannot reproduce, belong in a canary or progressive rollout where a small slice of real traffic exercises the change while a baseline group stays on the prior build.
The practical failure mode is trying to catch everything in one place. A staging environment that does not mirror production traffic shape will miss the N+1 query that only appears under real concurrency. A canary with no automated comparison against the baseline group is just a slower way to ship the regression to everyone. Each stage needs its own comparison logic.
| Stage | Best at catching | Comparison method | Limit |
|---|---|---|---|
| CI / unit + integration | Correctness and contract regressions | Assertions vs. expected output | Cannot see performance under real load |
| Load / performance test | Latency and throughput regressions under stress | Build vs. baseline under synthetic load | Synthetic traffic rarely matches production shape |
| Staging | Integration and config regressions | Production-like traffic vs. baseline | Only as realistic as its data and traffic |
| Canary / progressive rollout | Real-traffic behavior, saturation, error-budget burn | Canary cohort vs. baseline cohort on live traffic | Requires automated diffing to be useful |
| Early production (guarded) | The regressions nothing upstream could reproduce | Post-deploy delta vs. pre-deploy baseline | Blast radius must be controlled with rollback ready |
The takeaway: push each regression check to the earliest stage where the comparison is trustworthy, and treat the canary as a monitored experiment, not a waiting room.
Why do teams still miss regressions despite heavy monitoring?
Most teams miss regressions not because they lack data but because their signals are noisy, uncorrelated, and absolute rather than comparative. Alert fatigue is the top operational challenge in modern ops: when the majority of alerts are non-actionable, the one signal that actually predicts a regression gets tuned out with the rest. Adding more dashboards to that pile makes detection worse, not better, because it adds correlation work for a human who is already behind.
The deeper problem is that telemetry is often broken at the source. Engineers are hired to build features, not to write instrumentation, so teams lean on generic auto-instrumentation that lacks business context. Traces break across async boundaries and message queues. High-cardinality noise buries the signal. Healthy 200 OK responses and critical failures get sampled with equal weight. When the instrumentation itself is low-signal, no amount of downstream alerting logic will reliably surface a regression before it ships.
This is the gap between seeing and acting that older tooling never closed. Observability platforms made system state visible and left the interpretation, and the acting, to a person at an inconvenient hour. The same reflex applies to regression detection: dashboards show the p99 climbed, but a human still has to notice, correlate it to the deploy, and decide it is worth stopping the release. That is exactly the work that does not scale.
How does NeuBird AI approach catching regressions before the page?
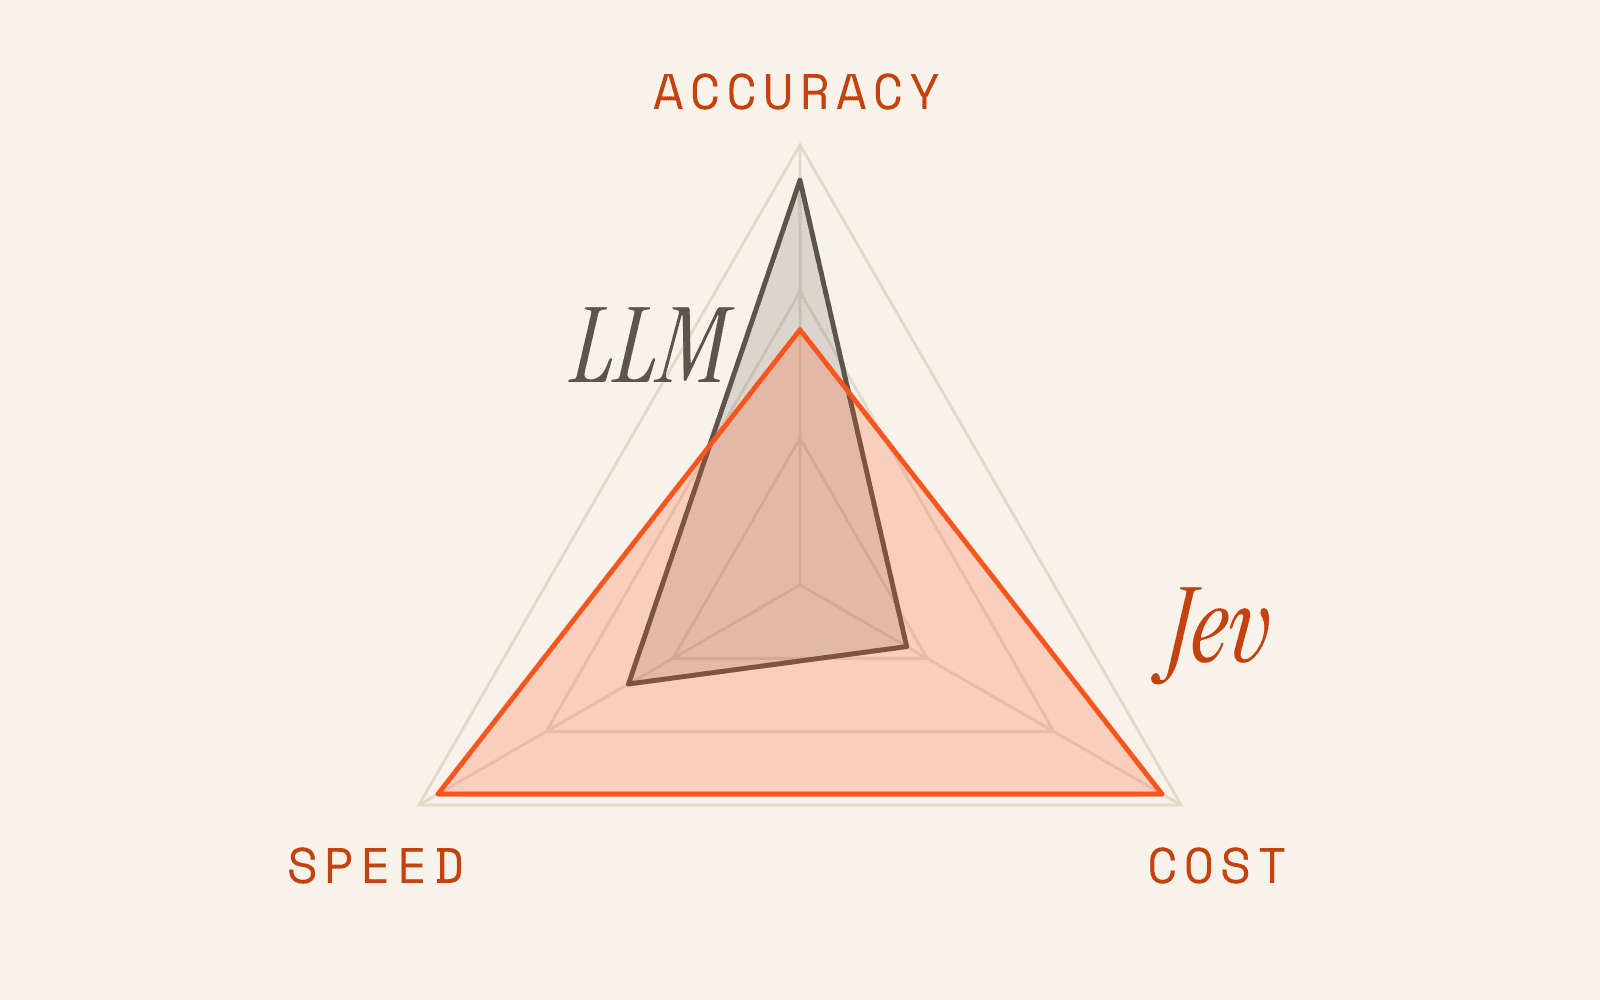
NeuBird AI is a Production Ops Agent platform: a platform of specialized agents, orchestrated as one, that runs inside your own environment to keep production running. Its model spans three pillars, and the relevant one here is Prevent: the agent works to fix observability at the source through agentic instrumentation, generating high-signal signals and scanning for degradation trending toward failure before a static threshold trips. That is the architectural answer to the regression problem, which is fundamentally a signal-quality and comparison problem, not an alerting-volume problem.
The distinction that matters for regressions: NeuBird AI acts, it does not just show a chart. It reasons over your live environment across many connected sources in parallel, so a degradation that is trending, a p99 creeping across deploys, a slow memory climb, a dependency getting flakier, can be caught and investigated rather than left for a human to spot in a panel. Its Prevent posture catches degradation 30 to 60 minutes early and drives 80% fewer P1 war rooms. It runs inside your environment with human-in-the-loop guardrails, approval gates on every action, and a full audit trail, so a caught regression stays a controlled event rather than a black-box one.
If you are building out how you evaluate this kind of tooling, our AI SRE evaluation guide covers why demos pass and production breaks, and the reliability posture behind it is framed in why the Production Operations Agent is the next frontier. For teams standardizing repeatable investigation and prevention logic across agents, see how we built an enterprise hub for production ops skills.
What should a pre-production regression-detection checklist include?
The short version: monitor the golden signals as deltas against a known-good baseline, correlate every delta to the change that caused it, watch the dependency and async boundaries that framework instrumentation ignores, and gate promotion on error-budget burn during a canary. Concretely, a team catching regressions before production should be able to answer yes to each of the following.
- Baseline comparison exists. Every performance-sensitive metric is compared build-over-build, not just against a fixed threshold.
- Changes are attributable. A regression delta can be tied to a specific commit, deploy, or config change without manual archaeology.
- The blind spots are instrumented. External dependencies, background jobs, queue consumers, and cross-service trace context are monitored, not just standard HTTP routes.
- The signal is high-signal. Error paths and anomalies are retained while healthy high-volume traffic is down-sampled, so a real regression is not buried in noise.
- Promotion is gated on burn rate. A canary that accelerates error-budget consumption blocks the rollout automatically instead of waiting for a human to notice.
The difference between a team that catches regressions and one that ships them is rarely the amount of telemetry. It is whether the telemetry is comparative, attributable, and acted on before the change reaches everyone.