DevOpsCon 2025: Where AI Moved From Hype to Hard Enterprise Problems

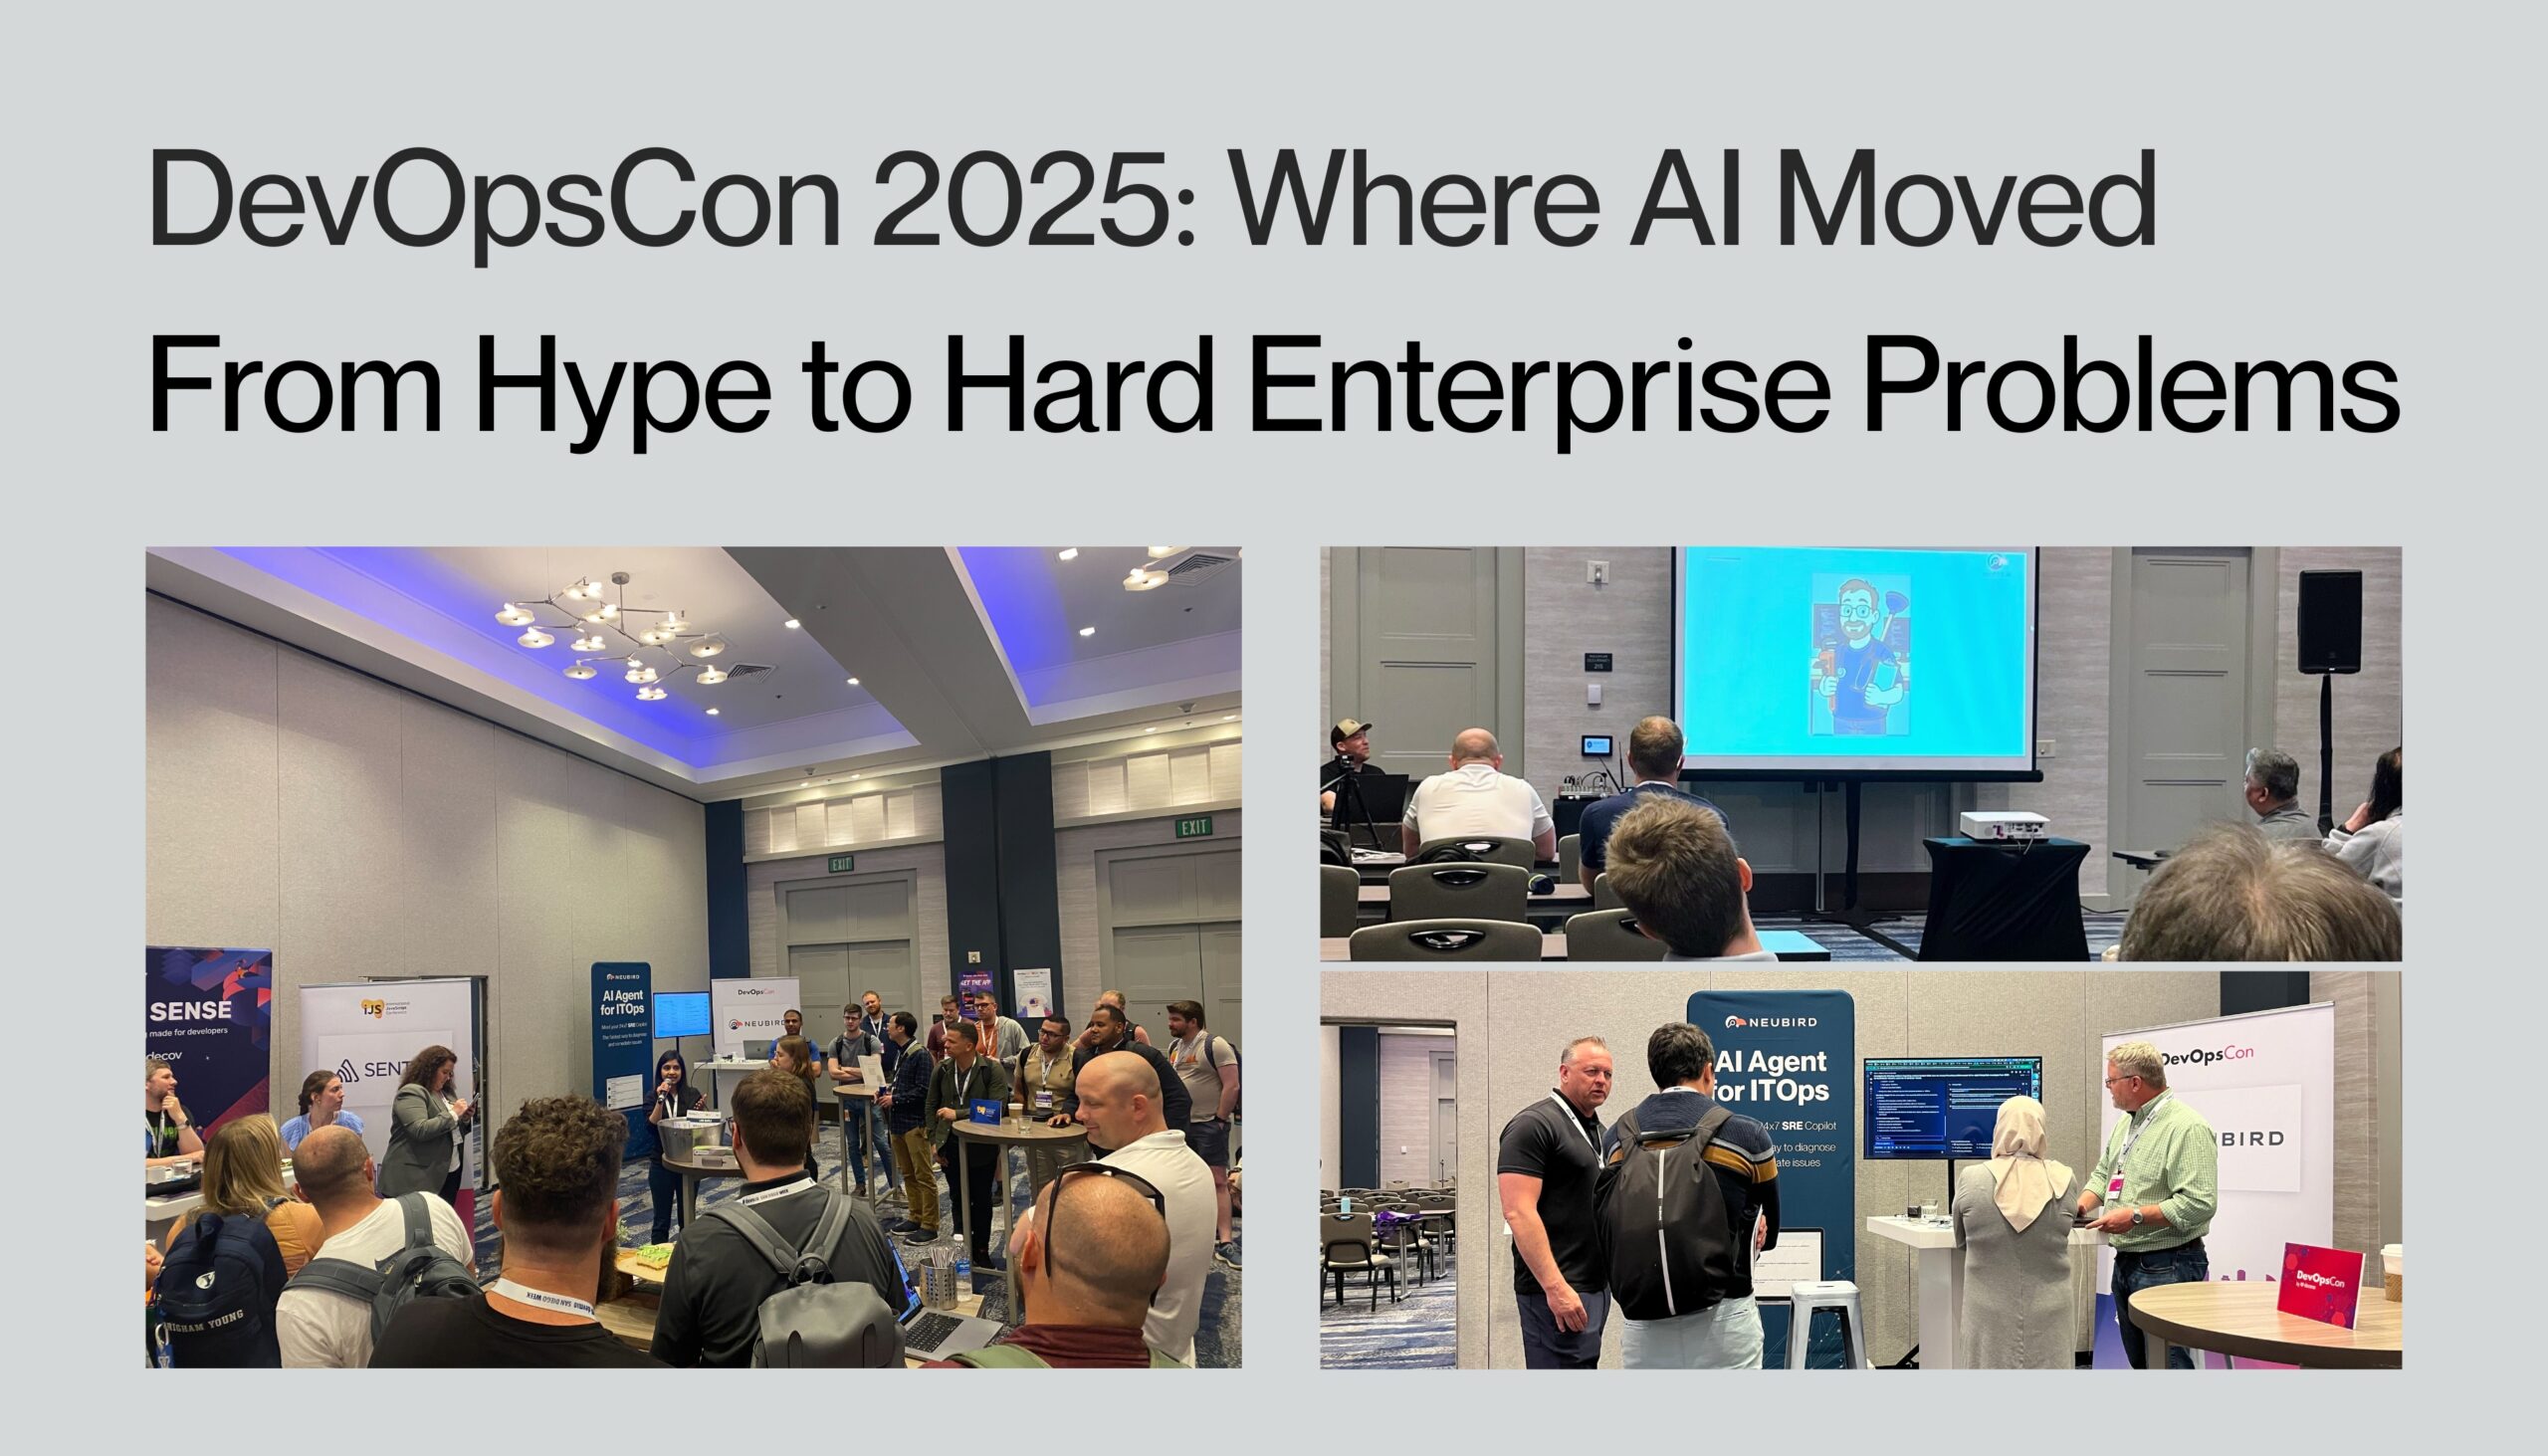
At DevOpsCon San Diego this year the energy was electric and the message was loud and clear: DevOps teams are navigating relentless operational complexity—and they’re looking for AI that actually works in their world. Not AI that lives in a demo, but intelligent automation that fits securely into hybrid environments, accelerates incident response, and helps engineers focus on what matters most.

Across sessions and conversations, the sentiment was strikingly consistent: teams don’t need more dashboards or alerts—they need fewer manual steps and faster root cause clarity.

AI Is Everywhere—But Pragmatism Is Back

AI agents and GenAI were everywhere at the conference, but the buzz was grounded in real-world need. Sessions underscored a shift in mindset: visibility is important—but insight and action are what actually move the needle.

DevOps professionals weren’t chasing the latest AI trend—they were seeking solutions to their most pressing operational challenges. The conversations I had at our booth consistently returned to one theme: how can AI help us work smarter, not harder?

On-Call Burnout Is Boiling Over

Incident response continues to drain DevOps teams. From late-night pings to hours spent tracing pipelines and logs, on-call has become more tedious and time-consuming—even as tooling has improved.

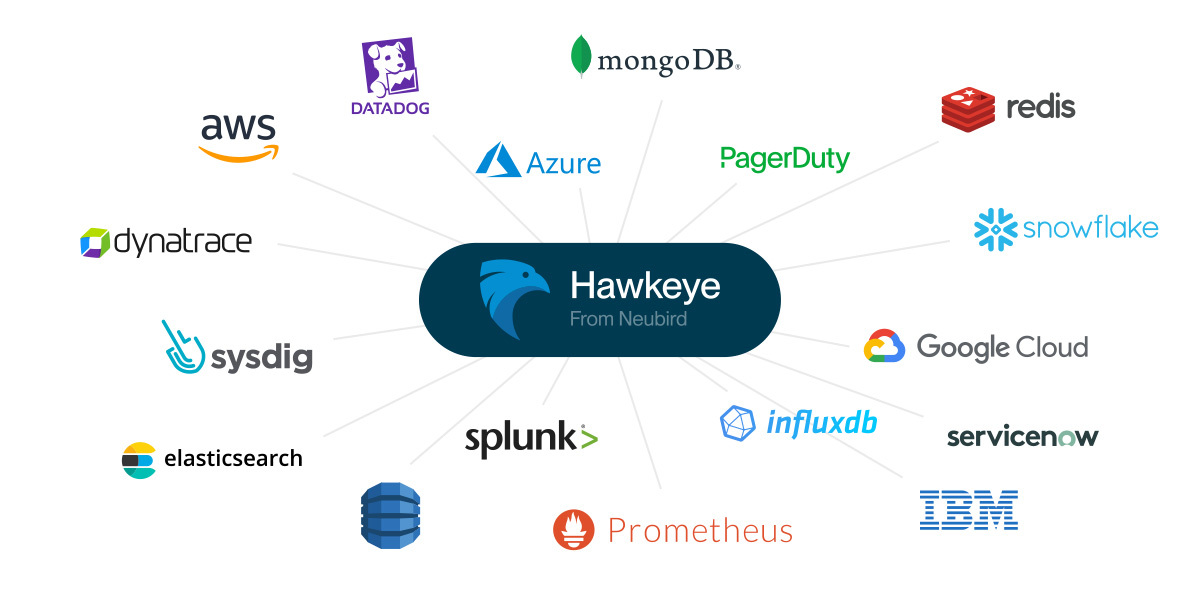
Teams are exhausted from stitching together fragmented telemetry. What they want is AI that understands their stack, integrates into existing systems, and helps get to the root cause faster—without adding another portal or platform to manage.

From Curiosity to Critical Path

Many teams shared past experiments with AI—mostly chatbots or copilots for ticketing or knowledge lookups. Useful, but shallow. Now, the question is different: “Can AI investigate incidents in our production environment without exposing our data?”

Security was a recurring theme. Multiple teams had tried sending telemetry into public LLMs and quickly rolled it back.

One CTO summed it up perfectly: “Dumping production logs into a public LLM isn’t innovation—it’s a liability.”

Sessions that explored successful AI implementation, like Justin Griffin’s real-world story of speeding up deployment investigations with an AI agent, sparked important discussions. During the Q&A, a recurring theme emerged from the audience: teams desperately want AI that can connect the dots between different failure points without requiring them to manually correlate data across multiple tools. As the session demonstrated, the value comes from combining reasoning with context—and doing it securely.

The Security-First AI Revolution

What struck me most about DevOpsCon 2025 was how security considerations are driving better AI adoption, not hindering it. Organizations have learned from early missteps and are now demanding enterprise-grade solutions.

Teams shared cautionary tales of experimenting with general-purpose LLMs—from hallucinated recommendations that caused production outages to security breaches from exposing sensitive telemetry data. The lesson is clear: enterprise operations require purpose-built AI agents, not retrofitted consumer tools.

The Path Forward: Secure, Embedded, Purpose-Built AI

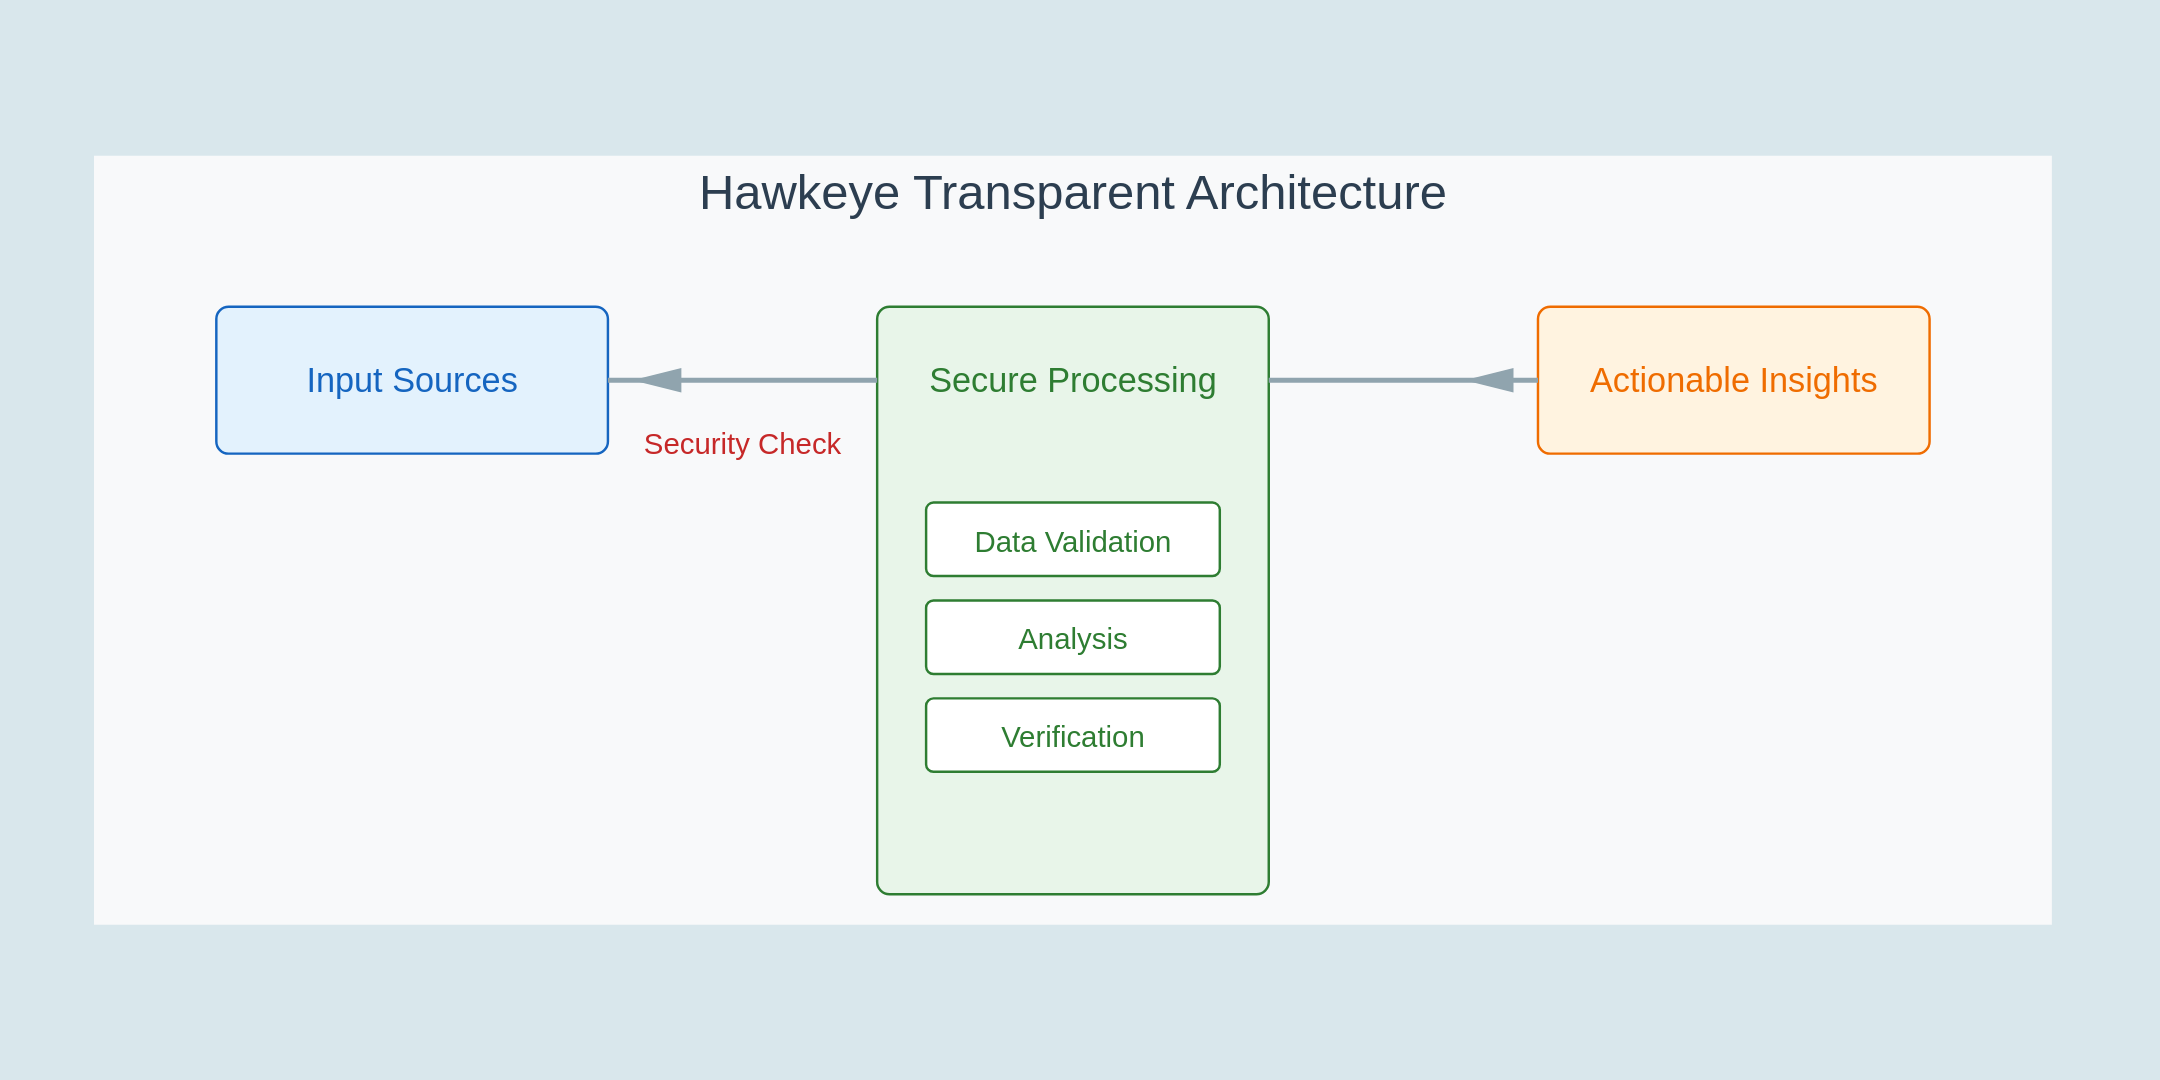
DevOps teams aren’t looking for bolt-on bots or generic copilots. They’re demanding intelligent agents that can integrate deeply with their observability and CI/CD systems, run securely in hybrid environments, and reason through telemetry rather than just summarize it.

That’s why interest in Neubird surged at our booth. Teams saw how it can operate in enterprise environments– cloud-native, on-prem and in hybrid cloud- using chain-of-thought workflows to surface root causes from real telemetry—without ever exposing sensitive data outside of their control.

DevOps Isn’t Getting Simpler—But Your Workflow Can

DevOpsCon 2025 made one thing clear: tool fatigue is real, alert overload is unsustainable, and AI has a critical role to play in restoring signal, trust, and speed.

Engineers aren’t asking AI to replace them. They’re asking for AI that thinks like an expert, works with them, and reduces the operational noise.

If that’s what your team is ready for, let’s connect. 👉 Book a demo to see how Neubird helps reduce MTTR, eliminate redundant work, and bring calm back to your on-call.

Enhancing Contextual Intelligence in AI Agents with MCP

In my previous article, I explored the delicate balance between speed, quality, and cost in AI agent design. Today, I want to dive deeper into how we’re enhancing our agentic AI SRE, Hawkeye, through the Model Context Protocol (MCP) – and why it’s a cornerstone for scalable, intelligent agentic workflows in enterprise environments.

The Enterprise Telemetry Challenge

As my co-founder Gou Rao recently noted, “In the world of Site Reliability Engineering (SRE) and IT operations, problems rarely come with clean, structured answers.” Enterprise IT teams have access to a wide range of telemetry through observability platforms, incident management tools, and internal dashboards. And in some cases, SREs still end up manually combing through logs to piece the puzzle together.

But the core challenge isn’t just access to data – It’s connecting relevant context in a way that makes the data actionable. A CPU spike means little without the surrounding environment: recent deployments,  config changes, or past anomalies.

Why Contextual Knowledge Is Essential

For an AI Agent to act autonomously—like a seasoned SRE—it must reason through complexity, not just surface patterns. That means asking follow-up questions, testing hypotheses, and adapting based on what it finds. This type of reasoning demands more than data ingestion. It requires contextual bridges—connections across systems that provide a unified operational understanding.

Enter the Model Context Protocol (MCP)

MCP connects AI agents to enterprise systems in a structured, dynamic way. MCP enables Hawkeye to navigate environments intelligently—pulling only what’s relevant, when it matters.

When an SRE asks, “Why are users experiencing delays when trying to log in — is the authentication service slower than usual?”, Hawkeye draws information from its existing connections to your tech stack, as well as from your MCP resources and tools:

  • CI/CD pipelines to retrieve deployment history 
  • Source control systems like Git to track and identify changes.
  • Docs, architectural diagrams, runbooks, and other sources of  tribal knowledge
  • Historical incidents that match current patterns

These connections span monitoring tools, code repositories, ticketing platforms, and internal wikis—creating contextual bridges that break down silos. Hawkeye synthesizes inputs from each source to build a coherent, real-time understanding of the issue.

From there, it activates its dynamic runbooks—or Hawkeye’s “chain of thought”—to move from symptom to root cause to remediation. This isn’t just access to data. It’s contextual reasoning in motion.

Practical Implementation

We’ve designed Hawkeye’s MCP integration with real-world production environments in mind:

  • Runtime flexibility: New connections can be added dynamically
  • Security-aware design: Scoped permissions protect boundaries
  • Cross-system correlation: Structured context allows pattern recognition across tools

Together, these capabilities support iterative, self-reflective reasoning—enabling Hawkeye to pursue hypotheses, revisit assumptions, and adapt its course like a human SRE would.

The Road Ahead for Agentic Systems

As enterprise environments grow more complex, the contextual awareness that MCP enables won’t just be useful—it will be essential. With rich environmental intelligence at the core, we’re advancing toward more autonomous and effective problem-solving.

This shift redefines what agents can do—elevating them from narrow, task-based tools to systems that reason across silos and act with precision.

At NeuBird, our mission is to build agents that think and adapt like real engineers. With context as their compass, we’re bringing that vision to life—and redefining what agentic AI can deliver for enterprise IT.


Building Trust in AI Operations: Neubird’s Approach to Transparency


In the rapidly evolving landscape of IT operations, artificial intelligence has emerged as a powerful force for managing complex systems. However, with this power comes a critical challenge: building and maintaining trust. At Neubird, we recognize that trust isn’t just about powerful technology—it’s about transparency, accountability, and consistent results. Let’s explore how Neubird’s approach to transparent AI operations is setting new standards in the industry.

For a full breakdown of how Neubird works, check out our deep dive blog.

The Trust Challenge in AI Operations

Traditional IT operations rely on human-readable logs, clear audit trails, and well-documented processes. When introducing AI into this environment, maintaining this transparency becomes both more crucial and more challenging. Engineers need to understand not just what actions were taken, but why they were chosen and how decisions were made.

Neubird’s Pillars of Transparent Operations

  • Explainable Decision Making

At every step of an investigation, Neubird maintains clear documentation of its reasoning process. Unlike black-box AI systems that simply provide conclusions, Neubird shows its work:

– Detailed investigation plans based on historical patterns

– Clear documentation of data sources consulted

– Step-by-step reasoning for conclusions drawn

– Evidence-based recommendations with supporting data

  • Comprehensive Audit Trails

In IT operations, accountability is non-negotiable. Neubird maintains detailed audit trails that track:

– Every investigation step taken

– Data sources accessed and queries executed

– Decision points and their rationale

– Recommended actions and their expected outcomes

These audit trails serve multiple purposes: they provide accountability, enable learning from past incidents, and help teams understand how Neubird adapts its approach over time.

  • Human Oversight and Control

While Neubird AI is powerful, it’s designed to augment human expertise, not replace it. Key aspects of this approach include:

– Customer-controlled access policies that can be revoked instantly

– Read-only operations by default, ensuring system safety

– Clear presentation of evidence for human validation

– Ability to adjust investigation parameters based on human input

The Role of Architecture in Trust

Neubird’s commitment to transparency isn’t just about features—it’s embedded in its architecture:

 Secure by Design

– Zero data storage policy ensures privacy

– Ephemeral processing protects sensitive information

– Read-only access prevents unauthorized changes

Verifiable Processing

The system’s telemetry program generation creates a clear chain of evidence:

– Programs are generated using controlled, fine-tuned LLMs

– Processing occurs in isolated memory spaces

– Results are consistently formatted and verifiable

– All data handling is traceable and auditable

Real-World Impact: From Trust to Value

The transparency built into Neubird creates a virtuous cycle:

  1. Clear evidence builds confidence in AI-driven decisions
  2. Understanding leads to better collaboration between AI and engineers
  3. Traceable outcomes enable continuous improvement
  4. Trust enables broader adoption and more valuable automation

 The Future of Transparent AI Operations

As AI continues to transform IT operations, transparency will become even more critical. Neubird’s approach demonstrates how AI can be both powerful and trustworthy, setting a new standard for the industry.

Traditional IT workflows are time-consuming and involve constant context switching. Engineers spend hours manually investigating alerts and correlating events before taking action.

  • Traditional SRE Workflow:
  1. Alert fires
  2. Check CloudWatch
  3. Open ServiceNow
  4. Investigate logs
  5. Correlate events
  6. Document findings
  7. Take action

Time spent: Hours
🔄 Context switches: 15+

With Neubird, this workflow is transformed into an AI-driven process that reduces manual effort while maintaining transparency and accountability.

  • Modern SRE Workflow with GenAI:
  1. AI correlates data
  2. Reviews root cause
  3. Implements solution

Time spent: Minutes
🔄 Context switches: 1

By using generative AI, Neubird reduces operational noise, streamlines investigations, and allows teams to focus on higher-level strategic tasks instead of repetitive workflows.

Ream more: Power-up your AWS CloudWatch and ServiceNow SRE workflows

Conclusion

In today’s business environment, trust isn’t optional, it’s essential. Neubird’s commitment to transparency, from its architecture to its outputs, ensures that teams can confidently embrace AI-driven operations while maintaining the accountability their organizations require.

The future of IT operations will be defined not just by what AI can do, but by how well it can be understood and trusted. Through its innovative approach to transparency, Neubird is helping shape that future today, enabling teams to build reliable, scalable, and trustworthy AI-powered operations.

To see Neubird AI in action and understand how it can elevate your IT operations, book a demo today and experience the future of trustworthy AI firsthand.

Unleashing Diagnostic Pack Intelligence With GenAI

Diagnostic packages are treasure troves of critical system insights—often trapped behind hours of manual analysis. Neubird liberates this valuable data, transforming tedious log investigations into rapid, precise problem-solving. What if you could turn complex diagnostic packages into actionable AI-powered intelligence in minutes?

The Hidden Goldmine in Your IT Operations

Every IT operations team knows the scenario: Your monitoring dashboards are green, but something still isn’t right. The real story often lies buried in diagnostic packages – packed with stack traces, system configs, and those detailed performance metrics – that teams have traditionally had to analyze manually. Until now, this valuable data has remained isolated from modern observability workflows, creating blind spots in incident investigation and resolution.

Bringing GenAI Intelligence to Diagnostic Packs

Support engineers and SREs, here’s to better days ahead! Neubird now applies its GenAI-powered intelligence to diagnostic packages, transforming tedious manual analysis into rapid, automated insights. Now you can finally say goodbye to hours of log parsing and hello to quick, precise problem resolution. This capability automates one of your most time-consuming tasks so you can focus on what matters most – both at work and beyond.

With this new capability, Neubird now:

  • Takes those dreaded diagnostic packages off your plate – let GenAI do the heavy lifting
  • Makes sense of the chaos by connecting the dots between your ticket context and diagnostic data
  • Delivers answers you can trust, backed by comprehensive analysis across all your data sources

See It In Action: Diagnostic Pack Issue Decoded 

Here’s a common support scenario: A “users can’t submit orders” ticket arrives with a massive diagnostic package attached. Our very own Grant Griffith demonstrates how this typical investigation transforms from a potential day-ruiner into a quick win. In the video below, watch how Neubird turns what used to be hours of log-diving into minutes of precise analysis. No more lost evenings, no more context-switching headaches – just precise, actionable insights from your diagnostic data.

Watch how Neubird:

  • Quickly identifies the interaction between two services – orders and billing
  • Pinpoints the root cause: a billing service memory error triggered by excessive retries 
  • Generates a comprehensive RCA document in seconds, complete with a detailed report of the incident and technical recommendations to prevent such issues in the future.

The entire process – from uploading the diagnostic package to having a complete RCA ready for the ticket – takes just minutes, transforming what could have been hours of log analysis.

Welcome to Better Days in IT Operations

IT teams know the scenario all too well – poring over massive diagnostic packages, knowing the answer is in there somewhere. Neubird turns those moments of frustration into quick wins. With their GenAI teammate onboard, ITOps teams gain instant insights from every investigation, resolving incidents faster and focusing their expertise on strategic initiatives.

Book a demo  to learn how Neubird can transform those diagnostic package challenges into opportunities to shine.

Transforming VDI Management and Monitoring with GenAI, ControlUp and Neubird Integration

How VDI Teams Are Shaking Up Their VDI Management & Operations with AI-Powered Analysis

Monday morning hits, and your VDI team is staring down dozens of ControlUp alerts about crummy user experience scores. Admins start digging into metrics, comparing performance data across virtual desktop sessions, trying to figure out if the root cause is the host, the network, or something else entirely.

Meanwhile, users are complaining about sluggish performance, and productivity takes a nosedive.
This happens all the time as VDI teams try to keep desktop performance solid while juggling increasingly complex virtual setups. ControlUp gives you deep visibility, sure, but as environments grow, the sheer amount of data can swamp anyone.

The VDI Monitoring Headache

Today’s virtual desktop environments are trickier than ever, supporting huge numbers of remote users who need a consistently good desktop experience. VDI monitoring tools like ControlUp capture this complexity with detailed metrics across many layers:

  • User experience scores
  • Application performance metrics
  • Resource utilization statistics
  • Network latency measurements
  • Host and hypervisor metrics
  • Login times and session data

While ControlUp is great at collecting and showing this data, VDI teams often find themselves bouncing between views, manually connecting metrics, and spending valuable time just trying to piece together the story behind performance hiccups.

The problem isn’t a lack of data. It’s making sense of it all when there’s so much.

The Limitations of Traditional VDI Monitoring

Even with good VDI monitoring solutions, organizations still hit roadblocks:

  • Too many disconnected alerts make it hard to know what’s important.
  • Performance data is stuck in silos, needing manual correlation.
  • Issues often only get attention after they affect users.
  • VDI admins burn hours investigating tricky problems.
  • Know-how about specific environment quirks stays stuck in individual admins’ heads.

These limits just get worse as VDI environments grow. When you’re supporting thousands of virtual desktops across different locations, even seasoned admins can get buried in monitoring data.

Meet Neubird AI: Your GenAI-Powered ControlUp VDI Monitoring Analyst

Think about a different way to handle VDI operations. Instead of people trying to swim through this data flood, Neubird acts like a smart agent that understands the tangled relationships in your virtual desktop environment. By connecting directly with ControlUp, Neubird changes how teams monitor, analyze, and tune their VDI infrastructure.

Neubird AI SRE doesn’t replace your VDI monitoring tools. It makes them way more valuable by applying AI to the data they already gather.

Beyond Just VDI Management

When looking into a VDI incident, Neubird does more than just basic metric checks:

  • It understands the relationships between hosts, sessions, and applications
  • It correlates performance metrics across different infrastructure layers.
  • It recognizes patterns in user behavior and resource use.
  • It figures out how infrastructure changes affect user experience.
  • It spots chances for optimization before users feel the pain.
  • It learns from every investigation, building a deep understanding of your specific VDI setup.

This analysis happens in seconds, not the minutes or hours it would take an admin to pull together and process the same info.

The New VDI Performance Management Workflow

Old-school VDI monitoring means admins have to:

  • Watch multiple ControlUp dashboards.
  • Switch between different metric views constantly.
  • Manually correlate performance data.
  • Document findings and what they did.
  • Hunt down related changes and configs.

With Neubird boosting your VDI workflow, admins start with a single view of the problem and all the relevant info needed to fix it. Routine issues come with clear, actionable advice, while complex problems get detailed investigation summaries that already include data from across your VDI environment.

Check out the video below or read more on how to transform VDI login performance with AI.

From Reactive to Proactive VDI Management

Pairing Neubird with ControlUp tackles core operational headaches. Finding experienced VDI administrators is tough and costly, and organizations are always under pressure to keep desktop performance up while managing costs.

Neubird AI changes the game by:

  • Automating routine investigations and providing intelligent analysis.
  • Identifying potential issues before they impact user experience.
  • Suggesting proactive optimizations based on usage patterns.
  • Building a knowledge base of environment-specific insights.
  • Helping new team members get up to speed faster.

The Path Forward: Smarter VDI Optimization

As Neubird learns your VDI environment, it moves beyond just fixing problems to proactively optimizing things by:

  • Predicting potential performance degradation before users are affected
  • Recommending resource allocation adjustments based on usage patterns
  • Suggesting configuration improvements for optimal user experience
  • Identifying opportunities for infrastructure optimization
  • Providing trend analysis for capacity planning

Getting Started

Adding Neubird AI alongside ControlUp is simple. The range of our AI SRE integrations mean you can connect it to your entire observability stack, creating a unified intelligence layer across all your tools.

  1. Connect Neubird to your ControlUp environment
  2. Configure access to relevant metrics and logs
  3. Begin receiving AI-powered insights and recommendations
  4. Watch as Neubird learns and adapts to your specific environment

Read more: 


Take the Next Step

Ready to improve how you manage your virtual desktop infrastructure? Check our demo or contact us to learn how Neubird can become your team’s AI-powered VDI analyst and help your organization handle the complexity of modern virtual desktop environments.

Related Reading

The Silent Treatment: Diagnosing VPN Interface Black Holes

How SRE teams are transforming VPN troubleshooting with AI

It’s 3 AM, and your monitoring system lights up with alerts about application connectivity issues. The initial investigation shows that traffic is flowing to your VPN interface, but seemingly vanishing into thin air before reaching its destination. Sound familiar? For network engineers and SRE teams, this “black hole” scenario is both common and frustratingly complex to diagnose.

The VPN Black Hole Challenge

Consider this recent scenario: A large e-commerce platform suddenly experienced order processing delays. Their payment service, running in AWS, couldn’t reach the payment processor’s API through a site-to-site VPN. Traffic appeared normal leaving the AWS environment, but never arrived at the destination. The monitoring dashboards showed green – the VPN tunnel was up, routes were in place, and security groups were correctly configured.

Yet the problem persisted. The traditional approach meant multiple teams manually checking:

  • VPN tunnel status and metrics
  • Route table configurations
  • Security group and NACL rules
  • BGP session states
  • MTU settings across the path
  • IPSec phase 1 and 2 configurations
  • Dead peer detection (DPD) timeouts

Each team had their own monitoring tools, none of which could correlate data across the entire path. Hours passed before someone noticed that a recent security patch had modified the IPSec transform set on one side of the tunnel, creating a mismatch that dropped packets silently.

Beyond Traditional Monitoring

The challenge isn’t lack of monitoring – it’s that traditional tools can’t connect the dots across complex network paths. Each dashboard shows its piece of the puzzle, but assembling the complete picture requires extensive manual correlation and deep networking expertise.

This is where AI-powered investigation transforms the game. When this same company encountered a similar issue two months later, Neubird AI SRE immediately:

  • Correlated VPN metrics from both endpoints
  • Detected the asymmetric traffic pattern
  • Identified configuration drift between tunnel endpoints
  • Pinpointed the exact parameter mismatch
  • Provided a clear remediation plan

What previously took hours of manual investigation across multiple teams was resolved in minutes.

The Power of Context-Aware Analysis

Neubird’s approach goes beyond simple metric monitoring. By understanding the relationships between network components, it can:

  • Track configuration changes across both ends of VPN tunnels
  • Correlate routing updates with traffic patterns
  • Monitor encryption parameters for mismatches
  • Detect subtle patterns in packet loss and latency
  • Identify asymmetric routing issues

More importantly, Neubird learns from each investigation, building a knowledge base of VPN failure patterns specific to your environment. This means faster resolution times and often, prevention of issues before they impact services.

From Reactive to Proactive

For network teams, this transformation means:

  • Fewer middle-of-night emergencies
  • Reduced mean time to resolution (MTTR)
  • Automated correlation of networking data
  • Early warning of potential VPN issues
  • More time for strategic network planning

Getting Started

Ready to transform your VPN troubleshooting? Neubird integrates with your existing network monitoring tools, including CloudWatch, Azure Monitor, and traditional NMS platforms. By connecting these data sources, you create a unified view of your network infrastructure with intelligent, AI-powered analysis.

Contact us to learn how Neubird can become your team’s AI-powered networking expert and help prevent VPN black holes from disrupting your services

Transforming CI/CD Pipeline Log Analysis with AI: From Information Overload to Instant Insights

How Development Teams Are Conquering Test Log Complexity with GenAI

Picture this: Your CI/CD pipelines are running thousands of tests each month, generating an overwhelming volume of logs. Your development team spends hours sifting through these logs whenever a test fails, trying to piece together what went wrong. With each passing sprint, the challenge only grows as your test suite expands. Sound familiar?

In today’s fast-paced development environment, continuous integration isn’t just about running tests—it’s about quickly understanding and acting on test results. Yet as organizations scale their testing practices, they face a growing challenge: the sheer volume of test logs has become overwhelming. Development teams running thousands of tests monthly find themselves drowning in log data, making it increasingly difficult to maintain velocity while ensuring quality.

This isn’t just about having access to logs. Modern CI/CD platforms provide comprehensive logging capabilities, and most teams have sophisticated test suites in place. The real challenge lies in the time and effort required to analyze these logs effectively. When a critical test fails, engineers often spend hours manually reviewing logs, correlating different test runs, and trying to identify patterns—time that could be better spent on innovation and feature development.

The Hidden Cost of Manual Log Analysis

The traditional approach to handling test failures typically involves:

  • Manually searching through logs to identify the point of failure
  • Cross-referencing multiple test runs to spot patterns
  • Investigating related code changes that might have contributed
  • Documenting findings for team knowledge sharing
  • Creating tickets for identified issues

This process is not only time-consuming but also prone to human error. Important details can be missed, patterns can go unnoticed, and valuable engineering time is consumed by what is essentially a data analysis problem. The impact on team productivity and morale is significant, with engineers spending more time investigating failures than writing new code.

Enter Hawkeye: Your GenAI Powered SRE for Log Analysis

Consider a fundamentally different approach. Instead of humans trying to process this flood of information, Hawkeye acts as your AI teammate that can instantly analyze thousands of test logs, identify patterns, and provide actionable insights. This isn’t about replacing your existing CI/CD tools—it’s about enhancing them with Hawkeye’s intelligent analysis capabilities that operate at machine scale.

Watch as Hawkeye analyzes complex test failures in real-time, providing immediate insights and actionable recommendations.

When investigating a test failure, Hawkeye provides:

  • Immediate correlation of current failures with historical patterns
  • Automatic identification of related code changes and commits
  • Context-aware analysis that understands your specific testing patterns
  • Natural language summaries that make complex issues understandable
  • Proactive identification of potential test flakiness

This analysis happens in seconds, not the hours it would take a human engineer to gather and process the same information. More importantly, the AI learns from each investigation, building a deep understanding of your specific testing patterns and common failure modes.

The Transformed Workflow

The transformation in daily operations is profound. Instead of spending hours manually searching through logs, engineers receive comprehensive analysis that includes:

  • Root cause identification with supporting evidence
  • Historical context for similar failures
  • Correlation with recent code changes
  • Recommended next steps for resolution
  • Patterns that might indicate broader issues

This shifts the engineer’s role from log parser to strategic problem solver, focusing on fixing issues rather than just finding them.

Beyond Log Analysis: Transforming Development Practices

The impact extends far beyond just saving time on log analysis. Teams that adopt Hawkeye often experience:

  • Reduced Mean Time to Resolution (MTTR) for test failures
  • Improved test suite reliability through better pattern recognition
  • Enhanced knowledge sharing across the team
  • More time for feature development and innovation
  • Better understanding of test suite behavior and patterns

For organizations, this translates to tangible benefits:

  • Faster release cycles
  • Improved code quality
  • Better resource utilization
  • Enhanced team satisfaction
  • Reduced operational overhead

The Path Forward

As development practices continue to evolve and test suites grow more complex, the traditional approach of manual log analysis becomes increasingly unsustainable. AI-powered analysis represents not just a tool, but a fundamental shift in how teams handle test failures and maintain quality at scale.

By leveraging AI to handle the heavy lifting of log analysis, teams can:

  • Focus on strategic problem-solving rather than log parsing
  • Identify and address systemic issues more quickly
  • Maintain velocity while ensuring quality
  • Build more robust and reliable test suites

Getting Started

Implementing Hawkeye alongside your existing CI/CD tools is a straightforward process that begins paying dividends immediately. While this blog focuses on test log analysis, Hawkeye’s capabilities extend to any aspect of your development pipeline that generates logs and requires investigation.

Ready to transform how your team handles test failures? Contact us to learn how Hawkeye can become your AI teammate in conquering test log complexity and accelerating your development pipeline. Our team will work with you to integrate Hawkeye with your existing tools and processes, ensuring a smooth transition to AI-powered log analysis.

Beyond the Balance: How AI Transforms Load Balancer Troubleshooting

How SRE teams are eliminating uneven traffic distribution with Hawkeye

Picture this: Your monitoring dashboard shows healthy instances, your load balancer configurations look correct, yet your application traffic is stubbornly refusing to distribute evenly. Some servers are overwhelmed while others sit nearly idle. Sound familiar? For SRE teams managing cloud-native applications, uneven load distribution isn’t just an annoyance—it’s a critical issue that can impact application performance, cost efficiency, and user experience.

The Hidden Complexity of Modern Load Balancing

Today’s load balancing challenges go far beyond simple round-robin distribution. Modern architectures involve:

  • Multiple load balancer tiers (L4/L7)
  • Dynamic instance health checks
  • Sticky sessions
  • Custom routing rules
  • Auto-scaling groups
  • Cross-zone balancing
  • Weighted routing policies

When traffic distribution goes awry, the root cause often lies in the complex interactions between these components. Traditional monitoring tools show you the symptoms—uneven server loads, response time variations, and throughput discrepancies. But pinpointing the exact cause requires correlating data across multiple layers of your infrastructure.

The Traditional Troubleshooting Treadmill

Currently, SRE teams face a time-consuming investigation process:

  1. Manually comparing traffic patterns across instances
  2. Analyzing load balancer access logs
  3. Reviewing health check configurations
  4. Checking for network issues
  5. Verifying session persistence settings
  6. Investigating application-level routing
  7. Cross-referencing recent infrastructure changes

This process typically takes hours, requiring deep expertise across networking, application architecture, and cloud services. Meanwhile, the uneven load continues to impact your application’s performance and reliability.

Enter Hawkeye: Your AI-Powered Load Balancing Expert

Hawkeye transforms this investigation process by automatically correlating telemetry data across your entire stack. Instead of manually piecing together the puzzle, Hawkeye’s GenAI capabilities provide immediate insights into load balancing issues:

  • Comprehensive Analysis: Hawkeye simultaneously analyzes load balancer metrics, application logs, network flows, and configuration changes to identify patterns and anomalies.
  • Root Cause Determination: By understanding the relationships between different components, Hawkeye can quickly identify whether uneven distribution stems from configuration issues, application behavior, network problems, or infrastructure changes.
  • Proactive Detection: Hawkeye learns your application’s normal traffic patterns and can alert you to subtle distribution anomalies before they become critical issues.

The Hawkeye Advantage in Action

When investigating load balancing issues, Hawkeye:

  1. Automatically correlates metrics across all load balancer tiers
  2. Analyzes traffic distribution patterns over time
  3. Identifies configuration drift or recent changes
  4. Checks for health check inconsistencies
  5. Verifies session persistence behavior
  6. Examines application-level routing decisions
  7. Provides clear, actionable remediation steps

Real Impact on Operations

For SRE teams, this means:

  • Reduced MTTR for load balancing issues from hours to minutes
  • Fewer false positives from normal traffic variations
  • Clear visibility into complex routing behavior
  • Proactive detection of potential distribution problems
  • More time for strategic infrastructure improvements

Moving Forward: From Reactive to Proactive

The future of load balancer management isn’t about better dashboards—it’s about intelligent analysis that understands your infrastructure’s behavior patterns. Hawkeye represents this shift, serving as an AI teammate that continuously monitors, analyzes, and optimizes your load balancing configuration.

Getting Started

Ready to transform how you manage load balancing? Hawkeye integrates seamlessly with your existing infrastructure:

  1. Connect your cloud provider’s load balancer metrics
  2. Enable access to configuration and change logs
  3. Start receiving intelligent, context-aware analysis

Don’t let uneven load distribution impact your application’s performance. Contact us to see how Hawkeye can help your team achieve optimal traffic distribution while reducing the operational burden of load balancer management.

When Every Millisecond Matters: Solving Real-Time Network Traffic Quality Issues

How SRE teams are transforming video and voice quality management with AI

In today’s hybrid work environment, a 200ms delay in video conferencing isn’t just an inconvenience—it’s the difference between seamless collaboration and frustrated teams missing crucial conversations. For SRE teams managing real-time communications infrastructure, these quality issues create a perfect storm of complexity: they’re time-sensitive, impact-heavy, and notoriously difficult to diagnose.

The challenge isn’t just about watching network metrics. Modern video and voice applications generate massive amounts of telemetry data across multiple layers: network paths, codec behaviors, endpoint performance, and infrastructure health. When quality degrades, engineers face the daunting task of correlating data across these layers in real-time, often while users are actively reporting issues

The Hidden Complexity of Real-Time Traffic

Traditional network monitoring approaches fall short when dealing with real-time traffic issues. While your dashboard might show acceptable overall network performance, users still experience stuttering video and choppy audio. Why? Because real-time communications require a different class of network quality:

  • Jitter and latency variations that barely impact web browsing can destroy video quality
  • Packet loss patterns that standard monitoring might miss can create noticeable audio artifacts
  • Micro-bursts of congestion can cause quality degradation without triggering traditional thresholds
  • Quality metrics need to be analyzed end-to-end, across multiple network segments and providers

Adding to this complexity, modern video and voice applications dynamically adjust to network conditions, making it challenging to establish baseline performance metrics. An issue that causes severe quality problems in one session might have minimal impact in another, depending on codec adaptations and endpoint behaviors.

Enter Neubird: Your AI-Powered Network Quality Expert

Instead of manually correlating metrics across multiple tools and time ranges, imagine having an AI teammate that understands the nuanced relationships between network behavior and real-time traffic quality. Neubird transforms how teams handle these challenges:

  1. Proactive Detection: By analyzing patterns across network layers, Neubird identifies potential quality issues before users report problems. It understands the specific network characteristics that impact real-time traffic and can spot subtle degradations traditional monitoring might miss.
  2. Rapid Resolution: Instead of spending hours manually investigating, teams receive comprehensive analysis identifying the root cause and recommended actions. Neubird’s understanding of real-time traffic requirements means it can distinguish between general network issues and those specifically impacting video/voice quality.
  3. Contextual Analysis: When quality issues occur, Neubird automatically correlates relevant data points:
    • Network path performance metrics
    • Infrastructure health indicators
    • Application-level quality metrics
    • Historical baseline comparisons
    • Configuration changes that might impact performance

The Transformed Workflow

The impact on daily operations is immediate. Traditional troubleshooting workflows require engineers to:

  • Monitor multiple dashboards across network and application layers
  • Manually correlate quality metrics with network performance
  • Analyze historical trends to identify patterns
  • Investigate potential infrastructure or configuration changes
  • Coordinate with multiple teams to implement fixes

With Neubird, engineers start with a unified view that automatically brings together all relevant information. Routine issues are quickly resolved using recommended actions, while complex problems come with detailed investigation summaries that include data from across your environment.

Moving Beyond Reactive Monitoring

For organizations heavily dependent on real-time communications, the transformation Neubird brings extends beyond technical efficiency. It enables a fundamental shift from reactive quality management to proactive optimization:

  • Quality issues are identified and resolved before they impact users
  • Network capacity and configuration decisions are guided by AI-driven analysis
  • Engineering teams focus on strategic improvements rather than firefighting
  • Users experience consistently high-quality video and voice communications

Ready to Transform Your Real-Time Traffic Management?

Implementing Neubird alongside your existing tools is straightforward and begins paying dividends immediately. While this blog focuses on video and voice quality, Neubird’s flexible integration capabilities mean you can connect it to your entire observability stack, creating a unified intelligence layer across all your tools.

Take the next step toward transforming your real-time communications quality management. Contact us to see how Neubird can become your team’s AI-powered network quality expert.

Image Pull Errors: How Neubird Streamlines Container Deployment Troubleshooting

How SRE teams are automating container deployment investigations with Neubird

Your team just deployed a new feature to production when PagerDuty alerts: “Maximum pod_container_status_waiting_reason_image_pull_error GreaterThanThreshold 0.0”. What should have been a routine deployment has turned into a complex investigation spanning multiple AWS services, container registries, and Kubernetes components.

The Modern Image Pull Investigation

Today’s container deployment issues occur in environments with sophisticated observability stacks. CloudWatch diligently logs every container event, Prometheus tracks your deployment metrics, and your CI/CD pipeline maintains detailed records of every build and deployment. Yet when image pull errors occur, this wealth of information often adds complexity to the investigation rather than simplifying it.

A typical troubleshooting session starts in your Kubernetes dashboard or CLI, where you see the ImagePullBackOff status. CloudWatch logs show the pull attempt failures, but the error messages can be frustratingly vague – “unauthorized” or “not found” don’t tell the whole story. You begin a methodical investigation across multiple systems:

First, you check AWS ECR to verify the image exists and its tags are correct. The image is there, but is it the version you expect? You dive into your CI/CD logs to confirm the build and push completed successfully. The pipeline logs show a successful push, but to which repository and with what permissions?

You switch to IAM to review the node’s instance role and its ECR policies. Everything looks correct, but when did these credentials last rotate? Back to CloudWatch to check the credential expiration timestamps. Meanwhile, you need to verify the Kubernetes service account configurations and secret mappings.

Each system provides critical pieces of the puzzle, but connecting them requires constant context switching and mental correlation of timestamps, configurations, and events across multiple AWS services and Kubernetes components.

Why Image Pull Errors Defy Quick Analysis

The complexity of modern container deployment means that image pull errors rarely have a single, obvious cause. Instead, they often result from subtle interactions between multiple systems:

An ECR authentication token might be valid, but the underlying instance role could be missing permissions. The Kubernetes secrets might be correctly configured, but the node might be pulling from the wrong registry endpoint. Network security groups and VPC endpoints add another layer of potential complications.

Your observability tools capture the symptoms across all these systems, but understanding the sequence of events and identifying the root cause requires simultaneously analyzing multiple authentication flows, networking paths, and permission boundaries.

Neubird: Your Deployment Detective

Here’s how Neubird transforms this investigation:

The Neubird Difference

What sets Neubird apart isn’t just its ability to check permissions or validate configurations – it’s how it analyzes the complex interactions between AWS services, Kubernetes components, and your deployment pipeline simultaneously. While an SRE would need to manually switch between ECR, IAM, CloudWatch, and Kubernetes tooling to piece together the authentication flow, Neubird processes all these systems in parallel to quickly identify where the chain breaks down.

Read more: Beyond deployment troubleshooting, a comprehensive monitoring strategy is essential. Learn how to move beyond static Kubernetes dashboards with Grafana, Prometheus and AI-enhanced observability.

This parallel analysis capability allows Neubird to uncover cause-and-effect relationships that might take hours for humans to discover. By simultaneously examining IAM policies, ECR authentication flows, network configurations, and Kubernetes events, Neubird can trace how a seemingly minor infrastructure change can cascade into widespread deployment failures.

Real World Impact

For teams using Neubird, the transformation extends beyond faster resolution of image pull errors. Engineers report a fundamental shift in how they approach container deployment reliability:

Instead of spending hours jumping between different AWS consoles and Kubernetes tools during incidents, they can focus on implementing systematic improvements based on Neubird’s comprehensive analysis. The mean time to resolution for image pull failures has dropped dramatically, but more importantly, teams can prevent many issues entirely by acting on Neubird’s proactive recommendations for authentication and permission management.

Implementation Journey

Integrating Neubird into your Kubernetes environment is straightforward:

  1. Connect your existing observability tools – Neubird enhances rather than replaces your current monitoring stack
  2. Configure your preferred incident response workflows
  3. Review Neubird’s incident analysis, drill down with questions, and implement recommendations.

Scale your team and improve morale by transforming your approach to application debugging from reactive investigation to proactive improvement. Let Neubirde handle the complexity of Image Pull Error analysis while your team focuses on innovation.


Follow
NeubirdLinkedIn

# # # # # #
Secret Link