A joint post from the teams at NeuBird and Confluent
For organizations running managed Confluent, the company behind Apache Kafka® as a central nervous system for their data, ensuring smooth operations is mission-critical. While Confluent Cloud eliminates much of the operational burden of managing Kafka clusters, application teams still need to monitor and troubleshoot client applications connecting to these clusters.
Traditionally, when issues arise—whether it’s unexpected consumer lag, authorization errors, or connectivity problems—engineers must manually piece together information from multiple observability tools, logs, and metrics to identify root causes. This process is time-consuming, requires specialized expertise, and often extends resolution times.
Today, we’re excited to share how NeuBird’s Hawkeye, a GenAI-powered SRE assistant, is transforming this experience by automating the investigation and resolution of Confluent Cloud incidents—allowing your team to focus on innovation rather than firefighting.
The Foundation: Kafka Client Observability with Confluent
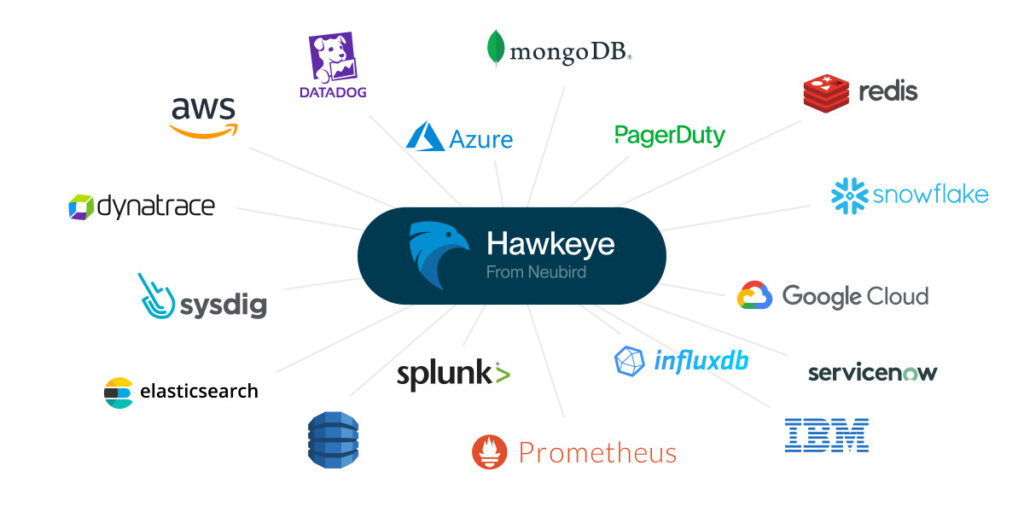
Confluent’s observability setup provides a strong foundation for monitoring Kafka clients connected to Confluent Cloud. It leverages:
- A time-series database (Prometheus) for metrics collection
- Client metrics from Java consumers and producers
- Visualization through Grafana dashboards
- Failure scenarios to learn from and troubleshoot
The demo is incredibly valuable for understanding how to monitor Kafka clients and diagnose common issues, but it still relies on human expertise to interpret the data and determine root causes.
Enhancing the Experience with Kubernetes and AI-driven Automated Incident Response
NeuBird builds on Confluent’s robust observability foundation by integrating Hawkeye, our GenAI-powered SRE, directly into the Kafka monitoring ecosystem. This combination goes beyond monitoring to introduce intelligent, automated incident response, significantly reducing Mean Time to Resolution (MTTR).
Here’s how NeuBird augments Confluent’s observability with three significant improvements:
- Kubernetes Deployment: We’ve containerized the entire setup and made it deployable on Kubernetes (EKS), making it more representative of production environments and easier to deploy.
- Alert Manager Integration: We’ve added Prometheus Alert Manager rules that trigger PagerDuty incidents, creating a complete alerting pipeline.
- Audit Logging: We’ve expanded the telemetry scope to include both metrics and logs in CloudWatch, giving a more comprehensive view of the environment.
Most importantly, we’ve integrated Hawkeye—NeuBird’s GenAI-powered SRE—to automatically investigate and resolve incidents as they occur, significantly reducing Mean Time to Resolution (MTTR).
Seeing it in Action: Authorization Revocation Scenario
Let’s walk through a real-world scenario from the Confluent demo: the “Authorization Revoked” case, where a producer’s permission to write to a topic is unexpectedly revoked.
The Traditional Troubleshooting Workflow
In the original demo workflow, here’s what typically happens:
- An engineer receives an alert about producer errors
- They log into Grafana to check producer metrics
- They notice the Record error rate has increased
- They check Confluent Cloud metrics and see inbound traffic but no new retained bytes
- They examine producer logs and find TopicAuthorizationException errors
- They investigate ACLs and find the producer’s permissions were revoked
- They restore the correct ACLs to resolve the issue
This manual process might take 15-30 minutes for an experienced Kafka engineer, assuming they’re immediately available when the alert triggers.
The Hawkeye-Automated Workflow
With our enhanced setup including Hawkeye, the workflow is transformed:
- Prometheus Alert Manager detects increased error rates and triggers a PagerDuty incident
- Hawkeye automatically begins investigating the issue by:
- Retrieving and analyzing producer metrics from Prometheus
- Correlating with Confluent Cloud metrics
- Examining producer logs for error patterns
- Checking AWS CloudWatch for audit logs showing ACL changes
- Within minutes, Hawkeye identifies the TopicAuthorizationException and links it to recent ACL changes
- Hawkeye generates a detailed root cause analysis with specific remediation steps
- An engineer reviews Hawkeye’s findings and applies the recommended fix (or optionally, approves Hawkeye to implement the fix automatically)
The entire process is reduced to minutes, even when the issue occurs outside business hours. More importantly, your specialized Kafka engineers can focus on more strategic work rather than routine troubleshooting.
Demo Video
In this video, we demonstrate the complete workflow:
- How we deploy the enhanced Confluent observability solution to Kubernetes
- Triggering the authorization revocation scenario
- Watching Hawkeye automatically detect, investigate, and diagnose the issue
- Reviewing Hawkeye’s detailed analysis and remediation recommendations
- Implementing the fix and verifying the resolution
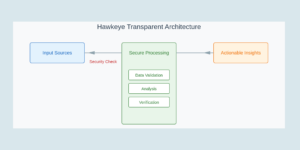
The Technical Architecture
Our enhanced solution builds upon Confluent’s observability foundation with several key components:
- Kubernetes Deployment: All components are packaged as containers and deployed to EKS using Helm charts, making the setup reproducible and scalable.
- Prometheus and Alert Manager: We’ve added custom alerting rules specifically designed for Confluent Cloud metrics and common failure patterns.
- AWS CloudWatch Integration: Both metrics and logs are forwarded to CloudWatch, providing a centralized location for all telemetry data.
- Hawkeye Integration: Hawkeye connects securely to your telemetry sources with read-only permissions, leveraging GenAI to understand patterns, correlate events, and recommend precise solutions.
The architecture respects all security best practices—Hawkeye never stores your telemetry data, operates with minimal permissions, and all analysis happens in ephemeral, isolated environments.
Real-World Impact
Organizations using Hawkeye with Confluent Cloud have seen significant operational improvements:
- Reduced MTTR: Issues that previously took hours to diagnose are now resolved in minutes
- Decreased Alert Fatigue: Engineers are only engaged when human intervention is truly needed
- Knowledge Democratization: Teams less familiar with Kafka can confidently operate complex Confluent Cloud environments
- Improved SLAs: With faster resolution times, application availability and performance metrics improve
As one example, an enterprise IT storage company reduced their MTTR for DevOps pipeline failures by implementing Hawkeye. When experiencing a crash loop with one of their applications causing production downtime, Hawkeye automatically picked up the alert from PagerDuty, investigated the issue, and determined that the crashes were happening due to a recent application deployment. Hawkeye recommended which specific application and process needed to be rolled back, dramatically reducing resolution time.
Getting Started
Want to try this enhanced observability setup with your own Confluent Cloud environment? Here’s how to get started:
- Start with the original Confluent observability demo to understand the components
- Check out our GitHub repository for the Kubernetes-ready version with Prometheus Alert Manager rules
- Schedule a demo to see Hawkeye in action with your Confluent Cloud environment
Conclusion
The combination of Confluent Cloud and Neubird’s Hawkeye represents a powerful shift in how organizations operate Kafka environments. By leveraging Confluent’s rich telemetry data and Hawkeye’s GenAI-powered automation, teams can significantly reduce operational overhead, improve reliability, and focus on delivering value rather than troubleshooting infrastructure.
As data streaming becomes increasingly central to modern applications and with availability of fully managed Kafka and Flink solutions in Confluent Cloud, this type of intelligent automation will be essential for scaling operations teams effectively—letting them support larger, more complex deployments without proportionally increasing headcount or sacrificing reliability.
We’re excited to continue innovating at the intersection of observability, AI, and data streaming. Let us know in the comments how you’re approaching observability for your Confluent Cloud environments!