When a production incident hits, the hardest part is rarely the fix. It’s figuring out what to fix. An engineer spends 20 minutes deploying a hotfix but 3 hours beforehand tracing through logs, metrics, and traces across a dozen services to identify the actual root cause. That investigation phase is where mean time to resolution lives or dies.
Root cause analysis tools help engineering teams diagnose production incidents faster by automating parts of the investigation process: correlating telemetry data, tracing failures across distributed systems, and surfacing the underlying cause of incidents rather than just the symptoms.
This guide covers the major categories of RCA tools, the leading options in each category, and what to look for when evaluating them.
Categories of RCA Tools
RCA tools fall into three broad categories, each with different approaches and capabilities.
1. Observability Platforms with RCA Features
These are primarily monitoring and observability tools that include root cause analysis as an add-on capability. They collect metrics, logs, and traces, and apply ML or rule-based analysis to identify anomalies and suggest root causes.
Datadog
Datadog’s Watchdog feature provides automated anomaly detection and root cause suggestions. It can identify correlated anomalies across services and highlight probable contributing factors. Datadog’s strength for RCA is its breadth of data: if you’re already sending metrics, logs, and traces to Datadog, its RCA features can correlate across all three. The limitation is that Watchdog’s analysis tends toward correlation (“these anomalies coincided”) rather than causation (“this caused that”). Datadog integration.
Dynatrace (Davis AI)
Dynatrace’s Davis AI engine is one of the more sophisticated RCA features in the observability space. It builds a real-time dependency map (Smartscape) and uses causal AI to trace failures through the topology. When a service fails, Davis can identify the originating service, even when dozens of downstream services are also affected. Its strength is topology-aware causal analysis rather than simple correlation.
New Relic’s AI-powered analysis surfaces anomalies and correlates them with deployments and configuration changes. Its “errors inbox” feature groups related errors and surfaces probable root causes. Good for application-level RCA, less comprehensive for infrastructure-level issues. New Relic integration.
Splunk
Splunk excels at log-based investigation. Its search processing language (SPL) is powerful for ad-hoc analysis, and its AI/ML toolkit can identify patterns and anomalies in log data. Splunk’s strength is flexibility (you can query almost anything), but root cause analysis requires significant manual effort to construct the right queries. Splunk integration.
2. AIOps Platforms
AIOps platforms focus specifically on alert correlation and noise reduction, which is a subset of RCA. They identify which alerts are related (reducing noise) but typically stop short of diagnosing the underlying cause.
Moogsoft
One of the original AIOps platforms (now part of Dell), Moogsoft uses ML to correlate alerts, reduce noise, and group related incidents. It’s effective at telling you “these 47 alerts are all part of the same problem” but relies on humans to determine what the actual problem is.
BigPanda
BigPanda focuses on event correlation and automated triage. It ingests alerts from multiple monitoring tools, correlates them into incidents, and routes them to the right team with enriched context. Like Moogsoft, it narrows the investigation scope but doesn’t complete it.
PagerDuty Event Intelligence
PagerDuty’s ML-based event intelligence groups related alerts and reduces noise. It’s integrated into PagerDuty’s incident management workflow, so correlated alerts feed directly into incident response. Good for triage but not a standalone RCA tool.
3. AI-Native Investigation Platforms
This is the newest category. Instead of adding AI features to existing monitoring or alerting tools, these platforms are built from the ground up to automate the investigation process.
Read more: For a deeper look specifically at the AI-native investigation category, including vendor-by-vendor evaluation criteria, see the Top AI SRE Tools.
NeuBird AI
NeuBird approaches RCA through context engineering: dynamically assembling the right information for each investigation at query time rather than relying on pre-indexed data. The Agent Context Engine traces causal chains across services with explicit reasoning at every step, reporting 94% accuracy in automated root cause identification. It connects to existing observability tools (Datadog, Splunk, New Relic, Prometheus, etc.) and reasons across all of them simultaneously.
What to Look for in RCA Tools
Integration breadth
Your telemetry data is spread across multiple tools. An RCA tool that only works with one observability platform misses the signals that live in other tools. Look for platforms that can query across your monitoring stack (Datadog, Prometheus, Elasticsearch, CloudWatch, etc.) rather than requiring all data in one place.
Causation vs. correlation
Many tools highlight correlated anomalies (“these metrics spiked at the same time”). Fewer tools establish causal chains (“this deployment changed this configuration, which caused this cascade”). Ask vendors specifically: does your tool show causation or just correlation?
Transparency of reasoning
When a tool says “the root cause is X,” can you see the evidence chain? Can you verify the reasoning? Opaque RCA (“trust us, it’s this”) is less useful than transparent RCA (“here’s the evidence: deployment Y happened at time T, which changed configuration Z, which caused metric M to spike, which triggered error E”).
Time to value
Some RCA tools require weeks of data collection before they can provide useful analysis (ML models need training data). Others can investigate from day one by querying existing data sources. Consider how quickly you need results.
Action vs. analysis
Some tools stop at diagnosis: they tell you what the root cause is. Others go further: they suggest remediation actions or can execute them. The value of fast RCA is diminished if it still takes hours to implement the fix. Tools that bridge the gap between “here’s the root cause” and “here’s the fix” deliver more complete value.
Cost model
Observability platforms typically charge per data ingested. AIOps platforms charge per event volume. AI-native platforms may charge per investigation or per seat. Consider which model aligns with your usage patterns and scales sustainably.
Learning and adaptation
Does the tool learn from your environment over time? A tool that provides the same generic analysis on day 100 as it did on day 1 isn’t capturing the institutional knowledge that makes experienced engineers effective. Look for tools that build organization-specific knowledge from past incidents, runbooks, and team feedback. This institutional learning is what separates a useful assistant from a truly effective diagnostic partner.
Building a RCA Toolchain
In practice, most organizations don’t rely on a single tool for root cause analysis. A typical RCA toolchain might include:
Investigation layer: An AI-native platform (NeuBird AI) or Dynatrace Davis for automated investigation
Documentation: Jira, Linear, or Notion for postmortem tracking and action items
The key is ensuring data flows between these tools. An AI investigation platform that can query your existing observability data (rather than requiring a separate data pipeline) reduces integration overhead and ensures the AI has access to the same data your engineers would use.
Key Takeaways
RCA tools fall into three categories: observability platforms with RCA features, AIOps platforms for alert correlation, and AI-native investigation platforms.
Observability platforms (Datadog, Dynatrace, New Relic) provide data and surface anomalies, but investigation often remains manual.
AIOps platforms (Moogsoft, BigPanda) reduce noise and group related alerts, but don’t diagnose root causes.
AI-native platforms (NeuBird AI) automate the full investigation process, tracing causal chains and producing diagnoses with evidence.
When evaluating tools, prioritize causation over correlation, transparency of reasoning, integration breadth, and the ability to bridge from diagnosis to action.
Choosing an on-call and incident management platform usually comes down to PagerDuty or Opsgenie. Both handle the same core problem: making sure the right person gets woken up when production breaks, and giving teams the tools to manage the incident response process. But they differ in pricing, ecosystem fit, feature depth, and where they’re headed.
This comparison breaks down how each platform works, where each excels, the tradeoffs involved, and whether the traditional alert-routing model they both represent is still sufficient for modern production environments.
PagerDuty: Overview
PagerDuty was founded in 2009 and went public in 2019. It’s the largest standalone incident management platform, with over 28,000 customers as of 2024. The platform started as an on-call notification tool and has expanded into a comprehensive incident management suite.
Core capabilities:
On-call scheduling with complex rotation support (multi-team, follow-the-sun, override schedules)
Alert routing with intelligent deduplication and suppression
Escalation policies with configurable timeouts and multi-level escalation chains
Event Intelligence (ML-based alert grouping and noise reduction)
Incident workflows (automated actions triggered by incidents)
Status pages for customer communication
Postmortem templates and tracking
700+ integrations with monitoring, ticketing, and communication tools
Pricing: Per-user, per-month. The Professional plan lists at around $29/user/month, Business tier at around $49/user/month (annual billing reduces these rates). Enterprise pricing is custom. Costs scale with the number of responders, not with infrastructure size or alert volume.
Opsgenie: Overview
Opsgenie was founded in 2012 and acquired by Atlassian in 2018. It’s now part of the Atlassian suite alongside Jira, Confluence, and Statuspage. This acquisition is both its biggest advantage (deep Atlassian integration) and a strategic consideration (dependency on Atlassian’s product roadmap).
Core capabilities:
On-call scheduling with rotation support
Alert routing and escalation
Alert deduplication, grouping, and enrichment
Incident management with timeline tracking
Integration with Jira for ticket creation and tracking
Integration with Statuspage for incident communication
Heartbeat monitoring (detect when expected check-ins stop arriving)
200+ integrations with monitoring and collaboration tools
Pricing: Opsgenie offers a free tier for up to 5 users (limited features). The Essentials plan is roughly $9/user/month. The Standard plan is approximately $19/user/month. Enterprise pricing is custom. Significantly cheaper than PagerDuty at equivalent tiers.
Head-to-Head Comparison
Feature
PagerDuty
Opsgenie
On-call scheduling
Advanced (multi-team, gaps detection, layers)
Good (covers most use cases)
Escalation policies
Highly configurable, battle-tested
Solid, slightly less flexible
AIOps / noise reduction
Event Intelligence (ML-based grouping)
Basic alert grouping and deduplication
Automation
Incident workflows, Rundeck integration
Alert actions, Jira automation rules
Integrations
700+ native integrations
200+ integrations, deep Atlassian suite
Mobile app
Polished, reliable
Functional, less refined
Ecosystem fit
Standalone, works with any stack
Best with Atlassian (Jira, Confluence, Statuspage)
You need best-in-class on-call management. PagerDuty’s scheduling, escalation, and notification reliability are the industry benchmark. If on-call management is mission-critical for your organization, PagerDuty’s maturity and reliability justify the premium.
You need advanced AIOps. PagerDuty’s Event Intelligence offers ML-based alert correlation that goes beyond basic grouping. For organizations processing thousands of alerts daily, this noise reduction is valuable.
You’re tool-agnostic. PagerDuty integrates with everything. If your monitoring stack is diverse (Datadog for some things, Prometheus for others, CloudWatch for AWS) or if you switch tools frequently, PagerDuty’s integration breadth is an advantage.
You need mature enterprise features. Analytics, stakeholder notifications, business service mapping, and advanced automation workflows are more developed in PagerDuty than Opsgenie.
When to Choose Opsgenie
You’re an Atlassian shop. If your team lives in Jira and Confluence, Opsgenie’s native integration is a significant workflow advantage. Incidents can automatically create Jira tickets, link to Confluence runbooks, and update Statuspage, all within the Atlassian ecosystem.
Budget is a primary concern. Opsgenie costs roughly half of PagerDuty at comparable tiers. For a team of 50 responders, that’s a difference of thousands of dollars per year.
Your on-call needs are straightforward. If you need basic scheduling, escalation, and alerting without advanced AIOps or enterprise features, Opsgenie covers the core use cases at a lower price point.
You’re a smaller team getting started. Opsgenie’s free tier for up to 5 users lets small teams adopt an incident management tool without any upfront cost. PagerDuty’s free plan exists but is more limited; paid tiers ramp up faster than Opsgenie’s.
Migration Considerations
If you’re switching between the two tools, consider these factors:
PagerDuty to Opsgenie: You’ll save on per-user costs but may lose advanced AIOps features and some enterprise integrations. If you’re also migrating to the Atlassian suite, the workflow gains from native Jira/Confluence integration can offset the feature gap. Plan for a parallel-run period where both tools receive alerts to validate routing and escalation behavior.
Opsgenie to PagerDuty: Budget for 2x the per-user cost. The migration typically involves recreating escalation policies, notification rules, and integration webhooks. PagerDuty’s migration tooling can import some configurations. The payoff is more sophisticated noise reduction, better analytics, and a more polished mobile experience.
For either direction: Test escalation policies thoroughly before cutting over. A misconfigured escalation chain during migration is a recipe for missed pages. Run both tools in parallel for at least 2 weeks, with one as primary and the other as shadow, to catch configuration gaps.
What Both Tools Share (and Where Both Fall Short)
Despite their differences, PagerDuty and Opsgenie share the same fundamental model: they route alerts to humans and manage the process of human incident response.
Both tools assume that:
A monitoring system detects a problem and sends an alert
The alert is routed to the right human
The human investigates, diagnoses, and resolves the problem
The tool tracks the process and facilitates communication
Neither tool investigates the problem. Neither diagnoses the root cause. Neither takes remediation action beyond triggering predefined scripts. The human remains the bottleneck in the process.
For straightforward environments with manageable alert volume, this model works fine. But as systems grow in complexity, the limitations become apparent:
Alert fatigue increases as more services generate more alerts
Investigation time dominates MTTR because the human has to manually query multiple tools
On-call burden grows with system complexity, leading to burnout and turnover
Beyond Alert Routing: The AI-Native Alternative
An emerging class of tools approaches incident management differently. Instead of routing alerts to humans, they use AI to investigate incidents autonomously and involve humans only when their judgment is needed.
NeuBird AI represents this approach. When an alert fires, NeuBird’s AI agent begins investigating immediately: querying observability data, correlating with recent changes, tracing request paths, and constructing a diagnosis. For routine incidents, it can execute remediation automatically. For complex ones, it presents findings and recommendations to the on-call engineer, who starts with context rather than a bare alert.
This doesn’t mean PagerDuty and Opsgenie become irrelevant. On-call scheduling and escalation management remain necessary. But the investigative burden that makes on-call painful (the “wake up, open six dashboards, figure out what’s wrong” part) is exactly what AI agents are designed to handle. NeuBird integrates with PagerDuty complementing their routing capabilities with autonomous investigation.
Key Takeaways
PagerDuty is the more mature, feature-rich option with better AIOps, broader integrations, and more enterprise capabilities. It costs more.
Opsgenie is the budget-friendly option with strong Atlassian integration and good coverage of core on-call needs. It costs roughly half as much.
Choose PagerDuty for complex, large-scale on-call operations. Choose Opsgenie for Atlassian-centric teams or budget-conscious organizations.
Both tools share the same fundamental limitation: they route alerts to humans but don’t investigate or resolve incidents.
AI-native platforms complement (and may eventually reduce the need for) traditional alert routing tools by automating the investigation that makes on-call burdensome.
PagerDuty and Datadog are two of the most widely adopted tools in production operations, but they solve fundamentally different problems. Datadog collects, visualizes, and alerts on telemetry data. PagerDuty routes those alerts to the right people and manages the incident response workflow. Most organizations that operate at scale end up using both, because one watches your systems and the other wakes up your engineers.
But the more interesting question isn’t which one to choose. It’s whether the paradigm they represent, dashboards plus alerts plus human investigation, is still the right model for how modern teams should run production.
This article compares PagerDuty and Datadog on their core capabilities, examines where each tool shines and where it struggles, and then asks a harder question: what happens when you rethink the model entirely?
What Datadog Does
Datadog is a cloud-based monitoring and observability platform. Founded in 2010, it’s grown into one of the largest players in the space, reporting $2.68 billion in revenue for fiscal year 2024. Its core product collects metrics, logs, and traces from infrastructure and applications, then lets teams visualize that data through dashboards and set up alerting rules.
Core capabilities:
Infrastructure monitoring: Agent-based collection of metrics from servers, containers, cloud services
APM (Application Performance Monitoring): Distributed tracing, service maps, latency analysis
Log management: Centralized log collection, search, and analysis
Dashboards: Highly customizable data visualization
Alerting: Threshold-based and anomaly detection alerts
Strengths: Datadog excels at bringing everything into one place. If you want a single platform for metrics, logs, traces, and security, Datadog delivers. The UI is polished, the integrations are extensive (750+), and the query language is powerful.
Limitations: The pricing model is the most common complaint. Datadog charges based on data ingestion volume and host count, which means costs scale with your infrastructure. Mid-sized companies commonly spend $50,000 to $150,000 annually. Enterprises regularly exceed $1 million. In one widely reported case, Coinbase’s Datadog bill reached $65 million in 2021 before the company restructured its observability approach (reported by The Pragmatic Engineer).
The fundamental product model is also worth examining. Datadog’s primary output is dashboards: visual representations of system state that require a human to interpret. When something goes wrong, an engineer opens Datadog, looks at charts, writes queries, and builds a mental model of what’s happening. The tool shows you data. You provide the reasoning.
What PagerDuty Does
PagerDuty is an incident management and on-call scheduling platform. Founded in 2009, it handles the “someone needs to wake up and deal with this” problem. When monitoring tools detect an issue, PagerDuty ensures the right person is notified through the right channel at the right time.
Alert routing: Receive alerts from monitoring tools, deduplicate, suppress, and route to the right team
Incident response: Incident creation, status updates, stakeholder communication, war room coordination
Automation actions: Trigger scripts or API calls in response to incidents
AIOps: ML-based alert grouping, noise reduction, and suggested responders
Status pages: Customer-facing incident communication
Strengths: PagerDuty is the standard for on-call management. Its escalation policies are battle-tested, and its integrations with monitoring tools (including Datadog) are mature. The mobile app is reliable for off-hours paging. PagerDuty’s Spring 2026 release, “The Path to Autonomous Operations,” signals their direction toward more AI-driven workflows.
Limitations: PagerDuty is fundamentally a routing and notification layer. It ensures the right human gets the alert. But it doesn’t help that human investigate the problem. Once the engineer is awake and staring at the PagerDuty notification, they still need to open Datadog (or Splunk, or Grafana, or CloudWatch) and manually figure out what’s going on. PagerDuty’s AIOps features reduce alert noise, which helps, but the investigation still depends entirely on the human.
Head-to-Head Comparison
Dimension
Datadog
PagerDuty
Core purpose
Monitoring and observability
Incident management and on-call
Primary output
Dashboards, metrics, logs, traces
Notifications, escalations, incident workflows
Alerting
Creates alerts based on telemetry data
Routes and manages alerts from external sources
Investigation
Provides data for human investigation
Does not provide investigation tools
Automation
Limited (Workflow Automation)
Event-driven automation actions
AI capabilities
Anomaly detection, log pattern analysis, Bits AI assistant
Teams needing reliable on-call and incident workflows
Most organizations running production systems at scale use both: Datadog for monitoring and PagerDuty for incident management. They’re complementary, not competing.
The Shared Limitation
Here’s where it gets interesting. Datadog and PagerDuty represent two halves of the same operational model:
Datadog collects data and shows it to humans through dashboards
PagerDuty wakes up humans when the data looks bad
A human interprets the data, diagnoses the problem, and fixes it
The human is the reasoning engine. Every other component in this chain, the monitoring, the alerting, the routing, the dashboards, exists to support human investigation and decision-making.
This model worked well when production systems were simpler. A monolithic application running on a handful of servers could be understood by a single engineer looking at a single dashboard. But modern production environments span hundreds of microservices, multiple cloud providers, container orchestration layers, serverless functions, and event-driven architectures. The volume of telemetry data has grown exponentially, and the relationships between components are too complex for any individual to hold in their head.
The result is what NeuBird’s blog describes as the dashboard obsolescence problem: “Dashboards only provide observability. Only the next generation of AI-native tools will provide true actionability.” Or, put more bluntly: “If you need a translator for your translator, the original medium has failed.” Dashboards convert system state into visual charts. AI assistants then convert those visual charts back into natural language explanations. The intermediate visual step was designed for human consumption, but humans can no longer process the volume effectively.
PagerDuty vs Datadog Pricing
Beyond the architectural limitations, there’s a practical cost issue.
Datadog’s pricing scales with data volume. More services, more metrics, more logs, and the bill goes up. This creates a perverse incentive: the more complex your systems become (and the more you need observability), the more expensive it gets. Teams start making decisions about what to monitor based on cost, not operational need. They sample logs, reduce retention, and skip instrumenting services that “probably don’t need it.” These are exactly the gaps that cause blind spots during incidents.
PagerDuty’s per-user pricing is more predictable, but it still scales with team size. And since PagerDuty’s primary function is routing alerts to humans, the cost is essentially a tax on human-in-the-loop incident response.
Combined, a mid-sized engineering organization might spend $200,000 or more annually on Datadog plus PagerDuty. An enterprise could spend well over $1 million. The question worth asking: what if a significant portion of that spend is going toward a paradigm that’s becoming less effective?
The Third Option: AI-Native Production Operations
There’s an emerging category of tools that don’t fit neatly into the “monitoring” or “incident management” boxes. Instead of collecting data for humans to interpret or routing alerts for humans to investigate, they apply AI to the entire operational lifecycle: preventing incidents, investigating them autonomously when they occur, and optimizing operations continuously.
NeuBird AI represents this approach. Rather than building more dashboards or smarter alert routing, NeuBird’s Agent Context Platform reasons directly over production telemetry, code, infrastructure, and operational knowledge. When something goes wrong, the AI agent investigates the way an experienced engineer would, but across all data sources simultaneously and in minutes instead of hours.
The key architectural difference is context engineering versus data hoarding. Traditional observability platforms ingest everything, store it, and charge you for the storage. NeuBird assembles the relevant context dynamically at query time. Why store and index every metric from every service when the AI only needs the signals relevant to the current investigation?
This changes the operational model:
Traditional (Datadog + PagerDuty)
AI-Native (NeuBird)
Collect all data, visualize it, alert on thresholds
Reason over data at query time, assemble context dynamically
Route alerts to humans
Investigate autonomously, involve humans for decisions
Human interprets dashboards
AI produces diagnosis with evidence chain
Cost scales with data volume + team size
Cost tied to operational outcomes, not data volume
Reactive: alert after something is wrong
Preventive: surface risks before alerts fire
This doesn’t mean Datadog and PagerDuty become irrelevant overnight. Many organizations will continue using them for specific needs. But the question of “PagerDuty vs Datadog” might be the wrong question. The better question is whether your operational model should still be built around dashboards that need human interpretation and alert routing that needs human investigation.
When to Use What
Choose Datadog if: You need deep infrastructure and application observability, your team is experienced at interpreting telemetry data, and you want a single pane of glass for metrics, logs, and traces. Be prepared for costs to grow with your infrastructure.
Choose PagerDuty if: You need reliable on-call scheduling, escalation policies, and incident workflows. PagerDuty remains the gold standard for ensuring the right person gets paged at the right time.
Consider NeuBird if: You want to move beyond the dashboard-and-alert paradigm entirely. If your team spends more time investigating incidents than fixing them, if alert fatigue is degrading your on-call experience, or if your observability costs are growing faster than your infrastructure, an AI-native approach may be worth evaluating.
Key Takeaways
Datadog provides monitoring and observability (collecting and visualizing data). PagerDuty provides incident management (routing alerts and managing response workflows). Most teams at scale use both.
Both tools are built on the same fundamental model: collect data, alert humans, let humans investigate. This model struggles as systems grow more complex.
Datadog’s per-ingestion pricing creates a cost-complexity spiral. PagerDuty’s per-user pricing scales with team size. Combined costs can exceed $1 million for enterprises.
AI-native platforms like NeuBird represent a different approach: reasoning over data at query time rather than storing everything, and investigating autonomously rather than routing alerts to humans.
The choice isn’t just “PagerDuty vs Datadog” but whether your operational model should still center on human interpretation of dashboards and manual incident investigation.
The incident that costs you four hours started with a three-line policy change nobody flagged.
The Invisible Failure Mode
NetworkPolicy failures are one of the most operationally expensive failure modes in OpenShift. Not because they’re technically complex, but because the failure almost never surfaces where the change was made.
A platform team adds a default-deny-all NetworkPolicy to a shared services namespace during a compliance audit. It looks correct. It’s scoped right. Twenty minutes later, six downstream teams are opening incidents. Their applications are throwing 503s. Database connection pools are exhausted. SREs are paging on-call engineers, all of them staring at logs that say “upstream connection refused” and “dial tcp: i/o timeout” with no further explanation.
Nobody is looking at the policy change. Nobody even knows it happened yet.
This is a visibility problem, not a complexity problem. OpenShift’s security model, including SCCs, NetworkPolicies, and OVN-Kubernetes, is correct and necessary. Multi-tenant platforms running financial workloads, healthcare data, or regulated services require strict policy enforcement. The problem is that the tooling available to debug policy-driven failures hasn’t kept pace with the density of policy changes that come with operating OpenShift at scale.
When one policy change can silently affect six namespaces owned by different teams, the operational cost of finding that connection is measured in engineering hours, not minutes. This post walks through how that debugging actually goes, what makes it hard, and how AI-driven investigation changes the equation.
How NetworkPolicy Works in OpenShift (and Why Failures Hide)
OpenShift 4.x ships with OVN-Kubernetes as its default CNI plugin, replacing the older OpenShift SDN, which is now deprecated. Understanding how OVN-Kubernetes enforces NetworkPolicy is essential to understanding why failures are so opaque from the application side.
The Enforcement Layer
NetworkPolicy objects define ingress and egress rules using label selectors. A policy says: pods with label app=frontend in namespace checkout may receive traffic from pods with label app=api-gateway in namespace platform. Everything else is denied. These policies are translated by OVN-Kubernetes into ACL (Access Control List) rules inside the OVN database and enforced at the node level, in the kernel’s flow tables.
This enforcement is completely invisible to application logs. When traffic is blocked, the packet is dropped at the node. The source pod sees a timeout. The destination pod never sees the connection attempt. Neither pod logs anything about a network policy. They log what they observe: connection refused, timeout, upstream unreachable.
Default-Deny and Its Consequences
A common compliance requirement is to apply a default-deny-all ingress and egress policy to namespaces that handle sensitive data. This is sound security posture. The problem is that in a running multi-tenant cluster, the full set of traffic paths is rarely fully documented. There are shared services, monitoring agents, internal API gateways, service mesh control plane traffic, and observability sidecars, all of which require explicit allow rules to function after a default-deny policy is applied.
A concrete example: a platform team hardening a shared authentication service namespace applies a default-deny-all NetworkPolicy followed by allow rules for the three consumer namespaces they know about. Six consumer namespaces exist. Three of them were undocumented. Those three immediately begin seeing authentication failures, which cascade into application-level 503s and database connection pool exhaustion as retry loops saturate the connection limit.
The platform team won’t know this happened until the incident tickets reach them, which typically takes 15 to 30 minutes after the alerts fire. By that point, multiple teams are in parallel debugging sessions, all looking at the wrong layer.
The Label Mismatch Problem
Even when the correct namespaces are included in a policy, label selectors can fail silently. If a policy selects pods using app=auth-service but the pods are labeled app=auth, the traffic is blocked. oc describe networkpolicy will show the policy as valid. The problem only becomes visible when you trace it to the specific pod labels, which requires checking the policy, the pods, and the traffic path in combination.
OVN-Kubernetes adds another layer: the ACL rules generated from a policy may span multiple logical switch ports, and the effective policy applied to a given pod depends on the union of all policies in that namespace plus cluster-level NetworkPolicies if they exist. A policy that appears to allow traffic may be overridden by another policy in the same namespace that has a stricter deny.
The result is a debugging problem that requires correlating events across multiple namespaces, change history, pod labels, and traffic flows simultaneously. Standard tooling surfaces each of these individually. The connection between them requires manual assembly.
The Standard Debugging Workflow (and Its Limits)
Here is what engineers actually do when a NetworkPolicy failure presents as application errors.
Step 1: Check pod logs in the affected namespace. The logs show “upstream connection refused,” “dial tcp: connection timed out,” or “EOF.” These are symptoms, not causes. Nothing in the logs indicates a network policy is involved.
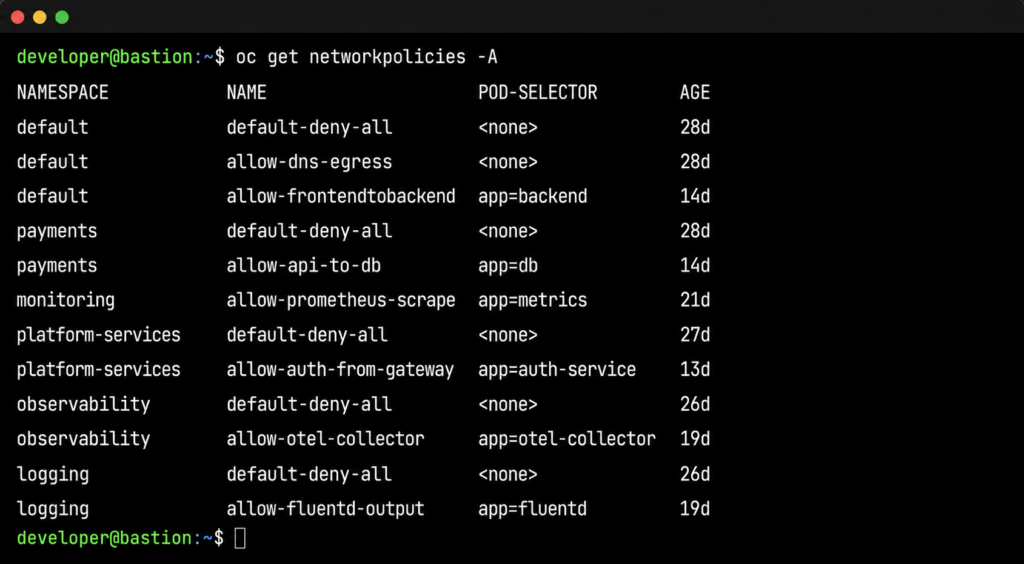
Step 2: Check NetworkPolicies in the affected namespace.oc get networkpolicies -n <failing-namespace> shows the policies applied to the consuming namespace. Unless the consuming namespace has an overly restrictive egress policy, nothing here explains the failure. The problem is in a different namespace, but there’s no signal pointing there yet.
Step 3: Start expanding the search. The engineer begins checking other namespaces: oc get networkpolicies -n <namespace> repeated across five, ten, twenty namespaces. oc describe networkpolicy <policy-name> -n <namespace> to examine rules. This is manual, sequential, and relies on the engineer knowing which namespaces to check.
Step 4: Trace the traffic path. What pods need to talk to what services, across which namespaces? In a well-documented system, this is straightforward. In a multi-tenant cluster that has evolved over two years, it often isn’t. Service mesh telemetry can help here if it’s available and the engineer knows to look there.
Step 5: Packet capture. If steps 1 through 4 haven’t identified the issue, the engineer reaches for oc debug node/<node-name> and runs tcpdump to capture traffic at the node level. This confirms whether packets are being dropped at the network layer. It doesn’t tell you which policy is dropping them.
Step 6: Cross-reference with change history. At some point, the engineer starts asking: what changed recently? This means querying GitOps history, checking change management tickets, or asking team members what was deployed in the last hour. This step is often the one that finally surfaces the policy change, but it depends on someone knowing to ask the question.
The problem with this workflow is not that any individual step is wrong. It’s that steps 1 through 4 can consume an hour before the engineer is even looking at the right namespace. In a cluster with 50 namespaces and overlapping policies, manually mapping the blast radius of a single bad policy is time-intensive work that requires institutional knowledge about which services depend on which other services.
The other cost is team fragmentation. When the consuming namespace and the policy namespace are owned by different teams, the incident can stay in the wrong team’s queue for a long time. The team that applied the policy has no alert telling them something broke. The team seeing the 503s doesn’t have access to the other team’s namespace. The investigation stalls at organizational boundaries.
What NeuBird AI Does Differently
The fundamental problem with NetworkPolicy debugging is that it requires correlating three things that live in three different places, none of which points at the others.
The policy change event: who changed what, when, in which namespace. This lives in GitOps history or change management records.
The traffic impact: which services started failing, at what time, with what error patterns. This lives in Prometheus metrics and Loki logs.
The dependency map: which namespaces and services need to communicate with each other. This lives in OpenShift cluster state and service mesh telemetry.
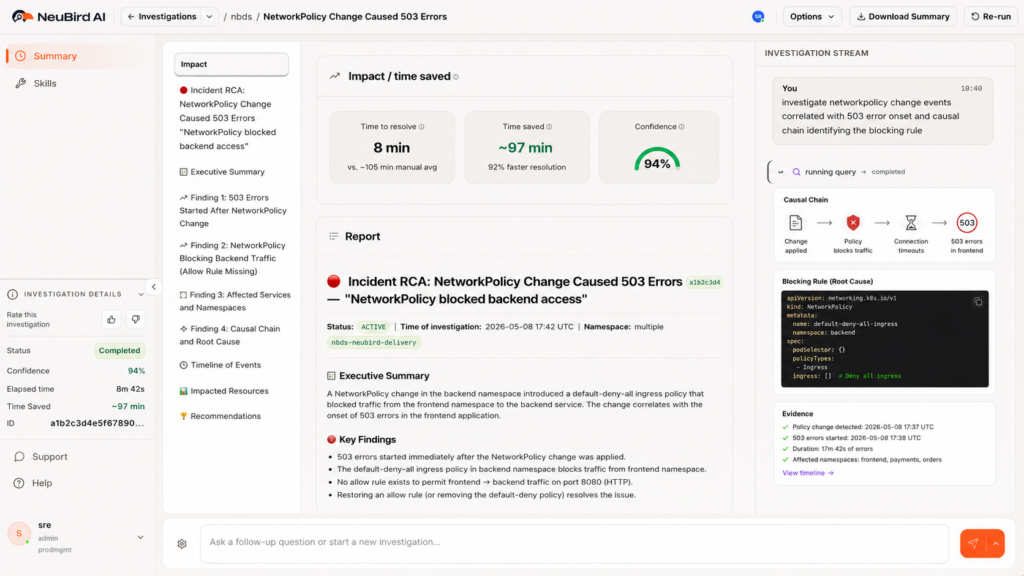
A human engineer with enough time and access can assemble these three things manually. NeuBird AI’s Agent Context Engine (ACE) assembles them automatically, across namespace boundaries, in the time it takes to read an alert notification.
How the Investigation Works
When services in namespace B begin returning 503s, NeuBird AI opens an investigation and does the following in parallel, not sequentially.
First, it correlates the failure onset timestamp with recent NetworkPolicy changes across all namespaces in the cluster. Not just the failing namespace. All of them. This is the step that breaks the manual workflow: NeuBird AI doesn’t need someone to know which namespace to look in.
Second, it identifies that a NetworkPolicy change in namespace A (the shared services namespace) preceded the failure onset by four minutes. This is the causal candidate.
Third, it maps the dependency graph. It knows that namespace B’s payment service makes outbound calls to namespace A’s authentication service, based on service mesh telemetry and historical traffic data. That traffic path is now covered by a default-deny-all policy in namespace A that has no corresponding allow rule for namespace B.
Fourth, it surfaces the specific policy, the specific rule, and the remediation. The blocking rule is identified by name. The fix is explicit: add a NetworkPolicy in namespace A allowing ingress from namespace B’s payment service pods, selected by label app=payment-service.
This is the difference between correlation and causation. Correlation tells you that 503s and a policy change happened around the same time. Causation, which NeuBird AI delivers, tells you that the policy change blocked a specific traffic path, which pods are affected, and exactly what to change to restore service.
FalconClaw Skills for Network Policy Enforcement
NeuBird’s FalconClaw skills hub extends this investigation with organization-specific knowledge. Platform teams can encode their own NetworkPolicy standards: required allow rules for monitoring agents, known-good policy templates for compliance namespaces, dependency maps for critical shared services.
When a new policy is applied that would violate those standards, FalconClaw fires before the traffic is affected. When an investigation surfaces a policy violation, FalconClaw can cross-reference against the organization’s documented standards to identify whether this is a known pattern or a novel misconfiguration.
Teams that have codified their network topology in FalconClaw skills get investigations that run against their actual dependency map, not a generic inference. The result is faster root cause identification in environments that have been operating for years and have accumulated undocumented dependencies.
The Numbers
NeuBird AI delivers 94% root cause accuracy, 78% reduction in alert noise, and up to 90% faster MTTR in production environments. For a NetworkPolicy failure that would otherwise consume two to four hours of SRE time across multiple teams, the investigation resolves in minutes. The teams that were in separate debugging sessions can close their incidents. The platform team sees the change and its impact together.
Prevention and Continuous Visibility
Finding failures faster is valuable. Not having them surface as production incidents is better.
NeuBird AI monitors cluster state continuously. When a new NetworkPolicy is applied, it evaluates the change against the live dependency map. If the policy would create a default-deny situation that blocks traffic paths currently in use, it fires an alert before the traffic is affected. The platform team knows the blast radius of the change before they apply it.
This is particularly useful for compliance-driven hardening passes, where the goal is to apply restrictive policies without breaking existing services. Currently, the standard approach is to apply the policy in a non-production environment and observe. That works when the non-production environment accurately reflects production traffic patterns, which it often doesn’t. NeuBird AI’s dependency map reflects actual production traffic, so the blast radius prediction is based on what is actually running, not what is documented.
NeuBird AI also detects in-progress failures that don’t yet have an obvious cause. When connection error rates in a namespace spike in a pattern consistent with a policy enforcement change (sudden onset, affecting all pods in a namespace uniformly, no application-level change events), NeuBird AI flags it as a policy candidate before the manual investigation begins. Engineers enter the debugging workflow already looking at the right layer.
The third piece is ongoing visibility into policy coverage. Which namespaces have default-deny policies? Which traffic paths are relying on implicit allow behavior that would break if a default-deny policy were added? NeuBird AI maintains this map continuously, so the answer is always current, not a snapshot from the last time someone ran a manual audit.
For platform teams managing hardened multi-tenant OpenShift environments, this level of visibility is the difference between network policy being a security tool and a liability.
Frequently Asked Questions
No. NeuBird AI works from the observability stack: Prometheus metrics, Loki logs, and OpenShift cluster state (via the Kubernetes API). It does not require direct access to the OVN database, the SDN data plane, or node-level tooling. This means it works without elevated node access and without changes to the CNI configuration.
Yes. Proactive monitoring evaluates new NetworkPolicy changes against the live dependency map and alerts when a change would block traffic paths that are currently in use. It also detects traffic pattern changes consistent with policy enforcement, such as sudden uniform connection failures across all pods in a namespace, and surfaces these as policy candidates before the manual investigation begins.
NeuBird AI crosses namespace boundaries automatically. The investigation is not limited to the namespaces the reporting team owns or has access to. The causal chain is surfaced regardless of which team applied the policy and which team is seeing the failure. Team silos don’t limit the investigation scope.
Yes. NeuBird AI reads from the observability stack rather than the CNI plugin directly, so it works with both OVN-Kubernetes (the current default) and legacy SDN deployments. The investigation methodology is the same: correlate policy change events with traffic impact using Prometheus and Loki data.
Yes, via FalconClaw skills. Platform teams can define required allow rules, known-good policy templates, dependency maps for critical shared services, and compliance baselines. FalconClaw skills run as part of every investigation and fire proactively when a policy change violates the defined standards. This is how teams with mature, well-documented network topologies get the most accurate and fastest investigations.
NeuBird AI is available as an in-cluster deployment via Helm chart, as a NeuBird-managed SaaS offering, and in air-gapped configurations for regulated environments. Setup connects NeuBird to your existing Prometheus and Loki instances and grants read access to cluster state. Most teams are operational within a day. No changes to application code, CNI configuration, or cluster networking are required.
Start Debugging Faster
NetworkPolicy failures will keep happening. Compliance requirements drive policy changes, and policy changes introduce risk that the standard tooling can’t surface quickly enough. The operational cost is real: engineering hours, cross-team coordination overhead, and the customer-facing impact of failures that take too long to find.
NeuBird AI cuts that time by correlating the three things that manual debugging assembles slowly: the change event, the traffic impact, and the dependency map. The result is root cause in minutes, not hours, with a specific fix, not a theory.
Hands-on playground:neubird.ai/playground. Try investigating a live NetworkPolicy failure in a real OpenShift-like environment. No setup, just your email.
Quick take: The AI SRE market splits into three tiers: legacy observability platforms with bolted-on AI, AIOps tools that correlate alerts but stop short of diagnosis, and a small group of AI-native platforms built around autonomous investigation. For teams that want a state-of-the-art, full-lifecycle production operations agent rather than another dashboard, NeuBird AI is the strongest pick: it reasons over your existing observability stack via context engineering, surfaces risks before they become incidents, and offers cloud, on-prem, and in-VPC deployment. The rest of this guide walks through all 20 tools in detail.
At-a-glance comparison
Tool
Best for
Key strength
NeuBird AI
Full-lifecycle AI-native production ops
Real-time prevention and autonomous investigation for enterprise production environments
Dynatrace (Davis AI)
Complex enterprise topologies
Topology-aware causal AI built into the observability platform
Datadog (Bits AI)
Teams already standardized on Datadog
Broad telemetry coverage with AI suggestions layered on dashboards
PagerDuty
Enterprise on-call and incident response
Mature alert routing with a newer SRE Agent for triage
BigPanda
High alert-volume enterprises
ML-based event correlation and noise reduction at scale
incident.io
Slack-centric engineering teams
AI-driven triage and fix-PR generation inside Slack workflows
Komodor (Klaudia)
Kubernetes-heavy organizations
Multi-agent autonomous remediation specialized for K8s
Better Stack
Startups and mid-size teams
All-in-one observability and incident response with built-in AI SRE
New Relic
Mid-size teams on a budget
Generous free tier plus AI-assisted error grouping
Rootly
SRE teams wanting Slack-first incident management
AI investigation tied directly to recent code changes
AI SRE tools have moved from experimental add-ons to essential infrastructure for production operations teams. The category has expanded rapidly, with platforms ranging from AI-enhanced observability tools to fully autonomous incident investigation agents. Some focus on reducing alert noise. Others aim to automate the entire incident lifecycle from detection through resolution.
The challenge isn’t whether to adopt AI SRE tooling. It’s choosing the right platform from a crowded and fast-moving market. This guide covers the 20 most notable AI SRE tools in 2026, with honest assessments of what each does well, where each falls short, and which types of teams each is best suited for.
What is AI SRE?
AI SRE applies artificial intelligence to site reliability engineering tasks: detecting anomalies, investigating incidents, identifying root causes, and in some cases, executing remediations automatically. The category has evolved through several phases:
AIOps (2017-2022): ML-based alert correlation and noise reduction. Platforms like Moogsoft and BigPanda grouped related alerts but left investigation to humans.
AI-assisted SRE (2022-2024): LLM-based copilots that help engineers investigate by summarizing incidents, suggesting next steps, and drafting postmortems. Humans still drive the investigation.
Autonomous AI SRE (2024-present): AI agents that investigate incidents end-to-end, trace causal chains across services, and propose or execute remediations. Humans shift from investigators to approvers.
The tools in this guide span all three phases. Some are observability platforms that added AI features. Others were built from the ground up for autonomous investigation. The distinction matters because it affects how deeply the AI can reason about your production environment.
Key Features to Look for
When evaluating AI SRE tools, these capabilities separate the leaders from the also-rans:
Investigation depth. Can the AI trace root causes across multiple services, data sources, and time windows? Or does it just surface correlated anomalies and leave the causal reasoning to you?
Integration breadth. Does the platform work with your existing observability stack (Datadog, Prometheus, Splunk, CloudWatch, etc.), or does it require its own data pipeline? Tools that query your existing data are faster to deploy and less disruptive.
Reasoning transparency. When the AI says “the root cause is X,” can you see the evidence chain? Opaque diagnoses erode trust and make it hard to verify correctness.
Remediation capabilities. Does the tool stop at diagnosis, or can it suggest and execute fixes? The gap between “here’s the root cause” and “here’s the fix” is where a lot of MTTR hides.
Institutional learning. Does the platform learn from your environment over time? A tool that provides the same generic analysis on day 100 as it did on day 1 isn’t capturing the operational knowledge that makes experienced engineers effective.
Safety and guardrails. For tools that take automated actions, what safety boundaries exist? Audit logging, blast radius limits, approval gates, and override mechanisms are essential for production use.
Comparison Table
Tool
Category
Architecture
Autonomous Remediation
Ideal For
Deployment
Pricing Model
NeuBird AI
AI-native production ops
Context engineering + Agent Context Platform
Autonomous investigation + guided remediation
Teams wanting full-lifecycle production ops AI
Cloud, On-Prem, In-VPC
Usage-based (per investigation)
Better Stack
Full-stack observability + AI SRE
eBPF + OpenTelemetry
PR generation, suggested fixes
Startups and mid-size teams wanting all-in-one
Cloud
$29/responder/mo + usage
BigPanda
AIOps event correlation
ML on event streams
Alert routing, limited automation
Large enterprises with high alert volume
Cloud / On-prem
Custom enterprise
Datadog (Bits AI)
Observability platform + AI
Agent-based collection + LLM
Suggested actions, workflow automation
Teams already using Datadog
Cloud
Per host + per GB
Dynatrace (Davis AI)
Observability platform + causal AI
OneAgent + topology mapping
Automated remediation via workflows
Complex enterprise environments
Cloud / Managed
Per host (consumption-based)
FireHydrant
Incident management + AI
Slack-native workflows
AI-suggested actions, runbook execution
Teams needing structured incident response
Cloud
Custom (contact sales)
Grafana Labs (Sift)
Open-source observability + ML
LGTM stack + ML diagnostics
Investigation only, no auto-remediation
Teams using Grafana/Prometheus stack
Cloud / Self-hosted
Free tier + Cloud pricing
Harness (AI SRE)
Software delivery + AI SRE
Change intelligence platform
Deployment rollback, feature flag toggles
Teams using Harness for CI/CD
Cloud
Bundled with Harness platform
incident.io
Incident management + AI SRE
Slack/Teams-native + AI agents
Fix PR generation, automated triage
Engineering teams with Slack-centric workflows
Cloud
Per responder/mo
Komodor (Klaudia)
Kubernetes-native AI SRE
Multi-agent, K8s-specialized
Autonomous K8s remediation
Kubernetes-heavy organizations
Cloud
Custom (contact sales)
Metoro
Kubernetes observability + AI SRE
eBPF auto-instrumentation
PR generation from runtime telemetry
K8s teams wanting zero-instrumentation setup
Cloud / Self-hosted
$20/node/mo
New Relic
Observability platform + AI
Agent-based + OpenTelemetry
Suggested actions, limited automation
Mid-size teams wanting generous free tier
Cloud
Usage-based (free 100GB/mo)
Observe
Unified observability + AI SRE
Streaming data lake + context graph
AI-guided remediation steps
Teams needing cost-effective log analytics
Cloud
Usage-based
PagerDuty
Incident management + AIOps
Event-driven + ML correlation
Workflow automation, SRE Agent (new)
Enterprise on-call and incident management
Cloud
$29-49/user/mo
Rootly
AI-native incident management
Slack-native + AI investigation
Code change analysis, suggested fixes
SRE teams wanting Slack-first incident response
Cloud
Custom (contact sales)
ServiceNow (ITOM AIOps)
Enterprise ITSM + AIOps
CMDB + ML event management
Workflow-based remediation
Large enterprises with ServiceNow ITSM
Cloud / On-prem
Enterprise licensing
Sherlocks.ai
AI SRE co-pilot
16+ specialized AI agents
Investigation + recommended actions
Teams wanting investigation-focused AI
Cloud
$15/investigation
Shoreline.io (Nvidia)
Runbook automation + AI
Op Packs (parameterized runbooks)
Automated runbook execution
Teams with well-defined operational runbooks
Cloud
Custom (acquired by Nvidia)
Splunk
Observability + security + AI
Search-based + ML toolkit
SOAR-based remediation (security focus)
Enterprises needing combined ops + security
Cloud / On-prem
Per GB ingested
Squadcast
Incident management + SRE
Alert routing + SLO tracking
Automated runbook attachment
Budget-conscious SRE teams
Cloud
Free tier, then $19/user/mo
The 20 Tools, Reviewed
1. NeuBird AI
NeuBird AI is a purpose-built Production Operations Agent powered by an Agent Context Platform that prevents, resolves, and optimizes production operations. Unlike observability tools that added AI as a feature, NeuBird was designed from the ground up around context engineering : dynamically assembling the right information for each investigation at query time rather than pre-indexing everything into a static data model.
Preventive Ops Insights surface risks before they become incidents
FalconClaw skills hub provides enterprise-grade operational skills with security review
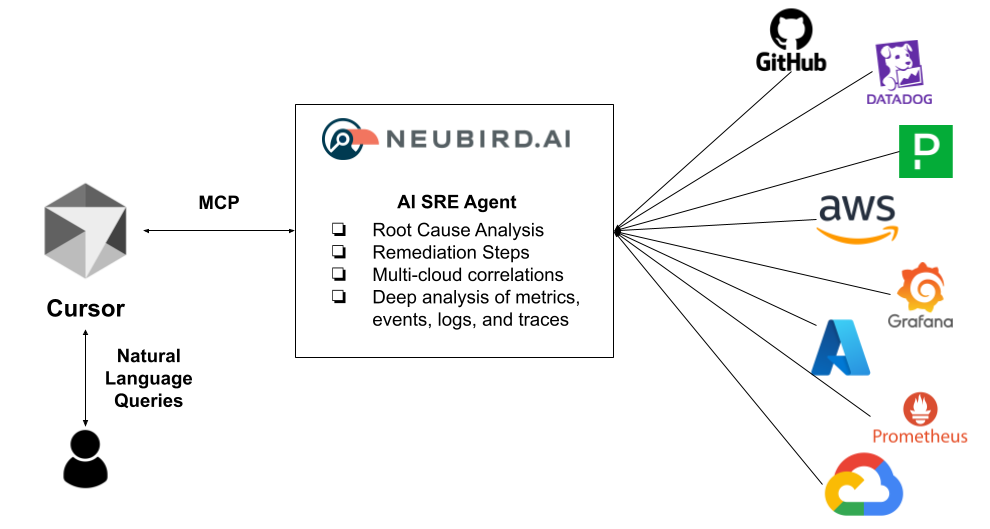
Available via web console, terminal UI (NeuBird AI Desktop), and MCP (Cursor, Claude Code)
Institutional learning: the platform gets smarter about your specific environment with every investigation
Cons:
Newer entrant compared to established observability vendors
Requires integration setup with existing monitoring tools
Ideal for: Teams that want to move beyond the dashboard-and-alert paradigm to AI-native production operations. Best suited for organizations with complex, distributed production environments where investigation time dominates MTTR.
Deployment: Cloud, on-prem, and in-VPC options available, making it suitable for organizations with strict data residency or compliance requirements.
Key differentiator: Context engineering. NeuBird doesn’t pre-index your data or require you to move to a new observability platform. It reasons over your existing tools in real time, assembling exactly the context needed for each investigation. This architectural approach means the AI is never working from stale data, which is critical because most incidents are caused by recent changes. Combined with 94% RCA accuracy, preventive intelligence, and institutional learning, NeuBird represents the most complete AI-native approach to production operations.
2. Better Stack
Better Stack combines uptime monitoring, log management, tracing, and incident management into a single platform with a built-in AI SRE. It uses eBPF-based service maps and OpenTelemetry to collect telemetry without manual instrumentation, then layers AI investigation on top.
Pros:
All-in-one platform (monitoring, logs, traces, on-call, status pages) at a fraction of Datadog’s cost
AI generates RCA documents with evidence timelines, log citations, and resolution steps
Can generate pull requests for new errors and write postmortems automatically
Transparent pricing with no annual lock-in for AI features
Cons:
Less depth in any single area compared to best-of-breed tools
Smaller integration ecosystem than established players
AI SRE capabilities are still maturing relative to dedicated investigation platforms
Ideal for: Startups and mid-size engineering teams wanting a cost-effective, all-in-one observability and incident response platform.
Pricing: Free tier available. Paid plans start at $29/responder/month for on-call features. Usage-based pricing for logs and monitoring.
Key differentiator: Price-to-capability ratio. Offers observability, incident management, and AI SRE in one package at a price point significantly below assembling the same capabilities from separate tools.
3. BigPanda
BigPanda is one of the original AIOps platforms, focused on event correlation and noise reduction for large enterprises. It ingests alerts from multiple monitoring tools, uses ML to identify related events, and groups them into actionable incidents.
Pros:
Proven at enterprise scale with high-volume alert environments
Strong integrations with ServiceNow, BMC, and enterprise ITSM tools
Positions itself as the “first Autonomous Operations platform”
Cons:
Primarily correlates alerts rather than investigating root causes
Does not provide its own observability data; depends entirely on external monitoring tools
Enterprise pricing may be prohibitive for smaller teams
Lags behind newer AI-native platforms in autonomous investigation depth
Ideal for: Large enterprises with high alert volume, multiple monitoring tools, and existing ITSM workflows that need noise reduction.
Pricing: Custom enterprise pricing. Not publicly listed.
Key differentiator: Enterprise-grade event correlation at scale. Best for organizations processing thousands of alerts daily across a fragmented monitoring stack.
4. Datadog (Bits AI)
Datadog’s Bits AI is a collection of AI agents embedded across the Datadog platform. They can launch investigations automatically when anomalies are detected, correlate signals across metrics, logs, and traces, and surface probable root causes within Datadog’s unified data model.
Pros:
Deep integration with Datadog’s comprehensive observability data (metrics, logs, traces, APM, RUM)
Bits AI agents act as automated first responders, assembling investigation narratives
Watchdog anomaly detection adapts to your environment’s patterns
Massive integration ecosystem (750+ integrations)
Cons:
Only works with data already in Datadog (can’t query external tools)
Pricing scales with data volume, which can become very expensive at scale
AI features are add-ons to an already complex pricing model
Investigation depth is limited compared to dedicated AI investigation platforms
Ideal for: Teams already heavily invested in the Datadog ecosystem who want AI capabilities without adding another vendor.
Pricing: Per host + per GB ingested across multiple product modules. Bits AI features included with certain plans.
Key differentiator: Breadth of data. No other platform has AI reasoning over metrics, logs, traces, APM, RUM, security, and synthetics in one place. The tradeoff is vendor lock-in and cost.
5. Dynatrace (Davis AI)
Dynatrace’s Davis AI is a causal AI engine built on top of Dynatrace’s Smartscape topology mapping. It automatically builds a real-time dependency graph of your environment and uses it to trace failures through the topology, identifying the originating service even when dozens of downstream services are affected.
Pros:
Topology-aware causal analysis (not just correlation), which is stronger than most competitors
Strong in complex, multi-tier enterprise environments
Cons:
Expensive, especially at scale
Tightly coupled to the Dynatrace ecosystem; less effective if you use other observability tools
The platform can feel heavyweight for smaller environments
Configuration and customization have a learning curve
Ideal for: Large enterprises with complex, multi-tier application architectures who need topology-aware root cause analysis.
Pricing: Consumption-based (DPS units). Typically more expensive than Datadog for equivalent environments.
Key differentiator: Topology-aware causal AI. Davis doesn’t just correlate events by timing; it traces causation through the actual dependency graph of your services.
6. FireHydrant
FireHydrant is an incident management platform that combines on-call scheduling, automated incident response workflows, and AI-powered investigation into a Slack-native experience. The AI generates incident summaries, transcribes video meetings, and produces retrospectives with root cause analysis.
Pros:
Unified platform: on-call, alerting, incidents, retrospectives, and status pages in one place
AI transcribes meetings, generates summaries, and drafts retrospectives
350+ API endpoints and Terraform support for automation
Acquired Blameless, gaining SLO tracking and error budget management
Cons:
AI capabilities are more assistive than autonomous (summarizes and suggests rather than investigates independently)
Less mature autonomous investigation compared to AI-native platforms
Primarily Slack-centric; less suited for Microsoft Teams environments
Ideal for: Engineering teams wanting a structured, Slack-native incident management platform with AI assistance for documentation and retrospectives.
Pricing: Not publicly listed. Contact sales.
Key differentiator: End-to-end incident lifecycle in one platform, from on-call through retrospectives, with AI assisting at every stage.
7. Grafana Labs (Sift / IRM)
Grafana IRM (Incident Response and Management) is a suite that includes Grafana Alerting, Grafana Incident, Grafana OnCall, and Grafana SLOs. Sift, the ML-powered diagnostic feature, automates routine investigation tasks: searching for error patterns, spotting container crashes, identifying overloaded hosts, and flagging recent deployments.
Pros:
Integrates natively with the Grafana/Prometheus/Loki/Tempo stack
Sift can be triggered automatically as part of on-call escalation chains
Open-source foundation with a strong community
No vendor lock-in on the observability data layer
Cons:
Sift is ML-based pattern detection, not LLM-based causal reasoning (shallower investigation)
IRM capabilities are less mature than dedicated incident management platforms
Requires significant Grafana ecosystem investment to get full value
No autonomous remediation capabilities
Ideal for: Teams already running the Grafana stack (Prometheus, Loki, Tempo) who want AI-assisted investigation without leaving their existing ecosystem.
Pricing: Grafana Cloud offers a generous free tier. Paid plans are usage-based. Sift is included in Grafana Cloud Pro and above.
Key differentiator: Open-source ecosystem. No vendor lock-in on observability data, with ML-based investigation layered on top.
8. Harness (AI SRE)
Harness is a $5.5B software delivery platform that extended into AI SRE with a focus on change intelligence. Its standout feature is the Human-Aware Change Agent, which listens to live conversations in Slack, Teams, and Zoom during incidents and connects human signals to deployment changes, feature flags, and configuration updates.
Pros:
Deep integration between software delivery and incident response (connects deployments to incidents automatically)
Human-Aware Change Agent is unique: correlates real-time conversation context with system changes
AI Scribe captures decisions and actions from incident calls automatically
Strong for organizations using Harness for CI/CD
Cons:
No built-in observability; requires Datadog, New Relic, or similar for metrics/logs/traces
AI SRE is bundled with the broader Harness platform (can’t buy standalone)
Pricing is opaque and typically expensive
Less effective for incidents that aren’t related to deployments or code changes
Ideal for: Organizations already using Harness for software delivery who want change-aware incident investigation.
Pricing: Bundled with Harness platform. Not available standalone. Enterprise pricing.
Key differentiator: Change intelligence. No other tool connects real-time human conversation during incidents with deployment and feature flag data as deeply.
9. incident.io
incident.io is a Slack-native incident management platform with a growing AI SRE capability. Its AI can automate up to 80% of incident response tasks: triaging alerts, correlating recent code changes with error spikes, generating environment-specific fix PRs, and producing detailed postmortems.
Pros:
Best-in-class Slack integration for incident coordination
AI generates actual code fix PRs, not just diagnosis
Heavily Slack-dependent; less effective in Microsoft Teams environments
AI investigation depth is growing but still maturing
Primarily focused on incident management workflow rather than deep production investigation
Premium pricing relative to some alternatives
Ideal for: Engineering teams that live in Slack and want AI-assisted incident management with code-level remediation suggestions.
Pricing: Per responder, per month. Contact sales for exact pricing.
Key differentiator: Workflow polish and fix PR generation. incident.io combines the best incident coordination UX with AI that can suggest actual code fixes, not just diagnostic summaries.
10. Komodor (Klaudia)
Komodor specializes in Kubernetes operations with Klaudia, a multi-agent AI SRE trained on telemetry from thousands of production Kubernetes environments. Named a Representative Vendor in the 2026 Gartner Market Guide for AI SRE Tooling, Klaudia uses 50+ specialized agents with reported 95% accuracy across real-world K8s incidents.
Pros:
Deep Kubernetes expertise: pod crashes, failed rollouts, autoscaler issues, misconfigurations
Multi-agent architecture with specialized agents for different K8s problem domains
Self-learning memory captures root causes and remediation patterns from every investigation
Folds cost optimization into the SRE loop (treats cloud spend as a reliability outcome)
Cons:
Kubernetes-centric; less relevant for non-containerized workloads
Requires significant K8s scale to justify the investment
Pricing is not transparent (contact sales)
Less general-purpose than platforms that cover the full infrastructure stack
Ideal for: Organizations running large Kubernetes environments who need a K8s specialist, not a generalist.
Pricing: Custom. Contact sales.
Key differentiator: Kubernetes domain depth. Klaudia’s agents are trained specifically on K8s failure modes, giving it an accuracy advantage in container orchestration environments that general-purpose tools can’t match.
11. Metoro
Metoro is a Kubernetes-native AI SRE that combines eBPF-based auto-instrumentation with an AI investigation agent called Guardian. One Helm install instruments every service in your cluster without code changes, and Guardian monitors for inconsistencies and investigates issues automatically.
Pros:
Zero-code instrumentation via eBPF (one Helm install, no SDK changes)
AI generates fix PRs from runtime telemetry
Predictable per-node pricing (no surprise bills from metric cardinality)
Free hobby tier for small clusters
Cons:
Kubernetes-only (no support for VMs, serverless, or bare metal)
Relatively new platform with a smaller user base
Investigation capabilities are focused on K8s-specific issues
Limited enterprise features compared to established players
Ideal for: Small to mid-size Kubernetes teams who want fast, low-overhead observability with AI investigation built in.
Key differentiator: Deployment simplicity. One Helm chart gives you full observability and AI investigation with no instrumentation effort. Lowest barrier to entry for K8s teams.
12. New Relic
New Relic is a full-stack observability platform that has added AI-powered features including anomaly detection, error correlation, and AI-assisted investigation. Its “errors inbox” groups related errors and surfaces probable root causes.
Pros:
Generous free tier (100GB of data ingest per month, forever)
Full observability stack (APM, infrastructure, logs, browser, mobile, synthetics)
AI investigation capabilities are less advanced than dedicated AI SRE platforms
Data ingest costs can escalate beyond the free tier
Incident management features are basic compared to dedicated platforms
No autonomous investigation or remediation capabilities
Ideal for: Mid-size teams wanting a full observability platform with AI features and a generous free entry point.
Pricing: Free tier with 100GB/month. Usage-based pricing above that.
Key differentiator: Free tier generosity. 100GB of monthly data ingest for free is unmatched in the observability market and makes New Relic accessible to teams that can’t justify Datadog or Dynatrace pricing.
13. Observe
Observe is a unified observability platform built on a streaming data lake architecture. It combines logs, metrics, traces, and business context into one queryable system, then layers an AI SRE that can correlate across all signal types to accelerate investigation.
Pros:
Unified data model eliminates the silos between logs, metrics, and traces
O11y Context Graph correlates signals for faster root cause identification
Cost-effective log analytics compared to traditional log management platforms
AI SRE provides chat-based investigation with targeted remediation steps
Cons:
Recently acquired by Snowflake (January 2026), introducing uncertainty about future direction
Smaller market presence and community compared to Datadog or New Relic
Autonomous remediation is limited to guided steps rather than automated execution
Platform maturity is still growing
Ideal for: Teams needing cost-effective unified observability with AI investigation, especially those already using or open to the Snowflake ecosystem.
Pricing: Usage-based. Contact sales.
Key differentiator: Streaming data lake architecture. Observe processes all telemetry types through a single data model, avoiding the cost multiplication that happens when logs, metrics, and traces are stored separately.
14. PagerDuty
PagerDuty is the industry standard for on-call management and incident response, and has been building toward autonomous operations. Its Spring 2026 release introduced SRE Agent, a virtual responder that can be added to on-call schedules and escalation policies, gathering signals across your stack to detect, triage, and diagnose incidents before paging a human.
Pros:
Battle-tested on-call scheduling and escalation (the industry benchmark)
Event Intelligence provides ML-based alert grouping and noise reduction
SRE Agent (2026) represents a significant step toward autonomous investigation
700+ integrations with monitoring, ticketing, and communication tools
PagerDuty Process Automation (Rundeck) adds runbook automation capabilities
Cons:
Primarily an alert routing and workflow platform; investigation depth is still developing
AI features (Event Intelligence, SRE Agent) are premium add-ons
Per-user pricing can become expensive at scale
SRE Agent is new and still proving itself in production environments
Ideal for: Enterprise teams that need rock-solid on-call management with growing AI capabilities.
Pricing: Professional ~$29/user/month, Business ~$49/user/month. SRE Agent is a premium feature.
Key differentiator: On-call management maturity. PagerDuty’s scheduling, escalation, and notification reliability are unmatched. The SRE Agent addition signals their direction toward autonomous operations, but the core value remains operational workflow excellence.
15. Rootly
Rootly is an AI-native incident management platform built around Slack integration. Its AI SRE analyzes code changes, telemetry, and past incidents to surface probable root causes with confidence scores, complete with highlighted code diffs and configuration changes.
Pros:
Slack-first design with excellent incident coordination workflows
AI surfaces root causes with confidence scores and code diffs
Purpose-built for SRE teams (not a general IT service management tool)
Cons:
Heavily Slack-dependent
Investigation depth depends on the quality of integrations with your observability tools
Pricing is not publicly listed
Less mature autonomous remediation compared to AI-native investigation platforms
Ideal for: SRE teams that manage incidents primarily through Slack and want AI that connects code changes to production impact.
Pricing: Custom. Contact sales.
Key differentiator: Code-change-aware investigation. Rootly’s AI connects incidents to specific code diffs and configuration changes with confidence scores, making it particularly useful for deployment-related incidents.
16. ServiceNow (ITOM AIOps)
ServiceNow’s ITOM (IT Operations Management) suite includes Predictive AIOps capabilities that sit on top of the Now Platform’s CMDB and workflow engine. ML-powered event management claims 99% noise reduction, and the 2026 “Agentic” updates introduce AI agents capable of independent reasoning and execution.
Pros:
Native integration with the ServiceNow ITSM ecosystem (change management, CMDB, workflows)
Event management noise reduction at enterprise scale
Predictive AIOps for proactive anomaly detection
Agentic AI capabilities (2026) moving toward autonomous investigation and remediation
Cons:
Heavy platform with significant implementation and administration overhead
Requires substantial ServiceNow ecosystem investment to realize value
Less suited for cloud-native, Kubernetes-first environments
AI capabilities are primarily focused on ITIL workflows rather than developer-centric SRE
Ideal for: Large enterprises with existing ServiceNow ITSM deployments who want to add AIOps and AI-driven operations on top of their existing CMDB and workflow infrastructure.
Pricing: Enterprise licensing. Typically six-figure annual commitments.
Key differentiator: ITSM integration. No other AI SRE tool integrates as deeply with enterprise change management, CMDB, and IT service workflows. For organizations where ITIL governance matters, ServiceNow is unmatched.
17. Sherlocks.ai
Sherlocks.ai is an AI SRE co-pilot that dispatches 16+ specialized AI agents to investigate production incidents autonomously. When an alert fires, Sherlocks correlates signals across your stack (Kubernetes, Datadog, Prometheus, AWS, New Relic) and delivers root cause analysis with clear next steps.
Pros:
Fast setup (read-only access, no agents to install, under 30 minutes)
Pay-per-investigation pricing model (no per-seat or per-host costs)
90% alert noise reduction reported
Monitors Slack for incident-related conversations and learns from team discussions
Cons:
Newer platform with a smaller customer base
Pay-per-investigation can become expensive at high incident volumes
Less mature autonomous remediation (focused on investigation and recommendation)
Limited information available on enterprise features and compliance
Ideal for: Teams wanting investigation-focused AI SRE without heavy infrastructure commitment, especially those attracted to pay-per-use pricing.
Pricing: Starting at $15 per investigation. Custom plans available.
Key differentiator: Pay-per-investigation pricing. Unlike per-seat or per-host models, you pay only when the AI actually investigates an incident, which aligns cost directly with value delivered.
18. Shoreline.io (Nvidia)
Shoreline.io, acquired by Nvidia in 2024 for approximately $100M, is a runbook automation platform that packages operational procedures as parameterized “Op Packs” that can execute automatically when specific conditions are met.
Pros:
Op Pack model makes runbook creation and sharing straightforward
Strong automation execution engine with fleet-wide command capabilities
Nvidia backing provides long-term investment and R\&D resources
Designed for high-frequency, well-defined operational tasks
Cons:
More runbook automation than autonomous AI investigation
Acquired by Nvidia, introducing uncertainty about standalone product direction
Requires well-defined runbooks to be effective (not helpful for novel failure modes)
Limited autonomous reasoning compared to LLM-based investigation platforms
Ideal for: Teams with well-defined, repetitive operational tasks who need reliable, automated execution at scale.
Pricing: Custom. Product direction may evolve under Nvidia ownership.
Key differentiator: Op Pack automation model. Shoreline excels at codifying and executing operational procedures consistently across large fleets, rather than investigating novel problems.
19. Splunk
Splunk is an enterprise observability and security platform with AI/ML capabilities for anomaly detection, event correlation, and automated response. Its SOAR (Security Orchestration, Automation, and Response) capabilities are particularly strong for security-related incident response.
Pros:
Powerful search and analysis engine (SPL) for ad-hoc investigation
Combined observability and security in one platform
SOAR capabilities for automated security incident response
Strong in regulated industries (financial services, healthcare, government)
Cons:
Expensive per-GB pricing model, similar to Datadog’s cost-scaling problem
AI capabilities are more traditional ML than LLM-based autonomous investigation
Heavyweight platform with significant operational overhead
Security focus means SRE-specific features are less developed than dedicated SRE tools
Ideal for: Enterprises needing combined IT operations and security operations in one platform, especially in regulated industries.
Pricing: Per GB ingested. Enterprise licensing available.
Key differentiator: Security convergence. Splunk is the strongest option for organizations that need to handle both operational incidents and security incidents from a single platform.
20. Squadcast
Squadcast is an incident management platform with SRE features including SLO tracking, error budget management, and automated runbook attachment. It offers a competitive alternative to PagerDuty and Opsgenie at a significantly lower price point.
Pros:
Built-in SLO tracking and error budget management (rare at this price point)
Transparent, affordable pricing with a free tier
AI/ML-driven alert noise reduction and pattern detection
Good for teams adopting SRE practices without enterprise budgets
Cons:
AI capabilities are more basic than dedicated AI SRE platforms (pattern detection, not autonomous investigation)
Smaller integration ecosystem than PagerDuty
Less suited for very large-scale enterprise deployments
No autonomous investigation or remediation
Ideal for: Budget-conscious SRE teams and startups wanting incident management with SLO tracking without enterprise pricing.
Pricing: Free tier available. Premium at $19/user/month. Enterprise at $26/user/month.
Key differentiator: SRE features at startup pricing. The combination of SLO tracking, error budgets, and incident management at this price point makes Squadcast accessible to teams that can’t justify PagerDuty’s cost.
How to Choose the Right AI SRE Tool
The right choice depends on where your team’s pain is:
If your biggest problem is alert noise: Start with AIOps capabilities (BigPanda, PagerDuty Event Intelligence, or built-in features from Datadog/Dynatrace). These reduce volume quickly without requiring a major platform change.
If your biggest problem is investigation time: Look at AI-native investigation platforms (NeuBird AI, Sherlocks.ai, Rootly). These compress the diagnosis phase that typically dominates MTTR .
If your biggest problem is Kubernetes operations: Komodor or Metoro are purpose-built for K8s failure modes and can deliver immediate value in container-heavy environments.
If your biggest problem is incident coordination: incident.io, Rootly, or FireHydrant excel at the human workflow side of incident management, with AI assisting at key steps.
If you Want to Rethink the Model Entirely
NeuBird AI is the strongest option for teams ready to move beyond the dashboard-and-alert paradigm toward autonomous production operations. Its context engineering approach, 94% RCA accuracy, preventive intelligence, and institutional learning make it the most complete AI-native solution available today. Rather than adding AI to an existing observability tool, NeuBird was built from the ground up around the principle that AI agents should reason over your production environment the way your best engineers do, but faster and across all data sources simultaneously.
You can try NeuBird AI in several ways to see if it is right for you:
How a small engineering team stopped drowning in alerts and started running production with confidence.
I lead engineering at a startup. We have no dedicated SRE function. No NOC (Network Operations Center). No overnight ops team watching dashboards. Just engineers who build things during the day and get paged at night. Monday morning used to mean opening my laptop to 47 unread PagerDuty notifications, a Slack channel full of overnight threads, and a dozen automated emails I didn’t have time to parse. My first hour wasn’t spent leading. It was spent triaging. Scrolling. Piecing together a timeline from breadcrumbs scattered across four different tools. And after all that? I’d still have to pull someone into a 20-minute Zoom just to ask: “What actually happened on your shift?” If that’s your reality too, you’ve felt the same thing I did: every morning that should start with strategy starts with scrolling through alerts instead.
The noise is the problem
According to the 2026 State of Production Reliability and AI Adoption Report, 83% of organizations juggle four or more tools during a live incident, and engineers burn 40% of their time on incident management instead of building products. Meanwhile, 78% experienced incidents where no alert was fired at all, and 44% had outages tied to alerts that were ignored or suppressed. For my team, it meant three engineers investigating the same root cause from three different entry points, not realizing they were working on the same problem. We were spending our time correlating, not fixing.
What my morning looks like now
We started using NeuBird AI’s Falcon engine for running our on-call about 2 months ago. It didn’t replace our monitoring or our runbooks. It replaced the manual cognitive labor of understanding what production is doing.
Now I open a single view and Falcon tells me what happened in the last 12 hours. Not a list of alerts. A narrative. Which incidents fired, which ones were related, what got resolved, and what still needs a human decision. Instead of 23 separate PagerDuty alerts, I see three actual problems. Two resolved. One needs me.
The NeuBird AI on-call shift brief: 12 hours of production distilled into what you need to know before your first sip of coffee.
Five incidents overnight. Three handled automatically. For the two that need me, I don’t get cryptic alert titles. I get a correlated story. The API gateway latency on the Payments service? Already linked to upstream Redis pool exhaustion, four related alerts grouped into one, with a recommendation to check connection limits. The Airflow scheduler restarts on the Data Pipeline? NeuBird AI found that the OOM pattern matches last Tuesday and Postgres query volume spiked 40% before each crash.
That 20-minute shift debrief? Gone. The context is there before I’ve opened my laptop.
Grouping incidents changed everything
When your monitoring fires 30 alerts and they’re all consequences of one bad deployment, you don’t need 30 investigations. You need one. But figuring out that they’re related used to take a senior engineer 45 minutes of clicking across dashboards and mentally mapping dependencies.
NeuBird AI’s Advanced Context Map builds a real-time view of infrastructure dependencies, service health, and blast radius. It shows how failures propagate across your environment, turning alert noise into actionable intelligence.
Seeing around corners
Look at the bottom of that shift brief. “Hot spots to watch.” Nothing is on fire. But NeuBird AI is telling me: the Redis cluster is degrading. Postgres query volume is elevated. Those are the breadcrumbs of the next incident.
Falcon’s Preventive Risk Insights continuously scan telemetry for these patterns: the disk slowly filling, the memory leak growing, the connection pool draining. For my team, this has been the difference between a weekend outage and a Tuesday afternoon fix.
The numbers
We’ve reduced PagerDuty alert volume by over 60% in four months. Not by suppressing alerts, but by fixing underlying issues before they trigger. My team went from a 60/40 split between product development and operational toil to closer to 85/15. That’s the equivalent of hiring four or five more engineers, except it’s recovered capacity, not headcount.
The quality improvements matter just as much. Root cause analysis generated from telemetry and infrastructure context beats reconstructed-from-memory postmortems. Structured shift handoffs mean fewer things fall through the cracks. Engineers who aren’t chronically tired from overnight pages write better code during the day.
The shift
I’m not going to pretend production operations are a solved problem. Systems break in ways nobody anticipated. But the workflow around operations: the information gathering, the signal extraction, the pattern recognition, the handoff – was never the hard part intellectually. It was the hard part operationally.
What Falcon gave my team wasn’t superhuman intelligence. It was superhuman attention. An always-on teammate that watches production continuously, contextually, and without getting tired at 3 AM.
My mornings are still busy. I’m an engineering leader at a startup. That’s the deal. But now I spend them making decisions instead of gathering information.
That’s the shift. Not from manual to automated. From drowning to driving.
Hallucinations are the failure mode that keeps AI developers up at night. For practitioners who worked in ML before the LLM boom, non-determinism has always been part of the job expressed as error margins, confidence intervals, or false positive rates. What has changed is scale and visibility: LLM failures are now labeled as “hallucinations” and treated as exceptional, even though they are a natural outcome of probabilistic models.
The problem becomes more severe because modern applications rarely use a single LLM call. We are increasingly building agentic systems, composed of multiple LLM invocations with chaining, iteration, tool use, and self-reflection. In such systems, even a small upstream error, such as an incorrect timestamp or a malformed identifier, can propagate through subsequent steps and result in a completely incorrect final response.
This risk is particularly high in AI SRE agents. If an LLM incorrectly identifies the service name, error code, or resource to investigate, downstream reasoning can confidently converge on the wrong diagnosis. In operational systems, this makes hallucination mitigation a correctness and reliability concern, not just a quality issue.
Why hallucinations occur is outside the scope of this article, but in short they are influenced by several factors: the underlying model, token count, token composition, instruction ambiguity, decoding parameters such as temperature, and even variability in model-serving infrastructure. The important conclusion is that hallucinations cannot be fully eliminated at the model level.
That said, while individual LLM calls are non-deterministic, the overall system does not have to be. These are still software systems with probabilistic components, and established engineering practices apply.
1. Treat LLM systems as production software
Non-deterministic components do not remove the need for rigor. Write evaluation suites, unit tests, and end-to-end tests that explicitly measure system behavior under realistic failure modes. Testing remains the primary mechanism for reducing uncertainty.
The challenge with writing tests against agentic AI powered applications usually lies in the input space. The input can vary significantly from the handful cases developers may have tested the system with. On the other hand, for ML models, tests are done in the form of large datasets and measuring the performance of the model on that curated large dataset. Though it is hard to curate a dataset that has all possible inputs to the system, it is important to start small and increase the diversity of the examples in your dataset.
2. Use structured and typed outputs
The more structured the LLM output, the easier it is to validate. Enforcing schemas, typed fields, and constrained formats significantly reduces silent failure and makes downstream checks deterministic. Many popular model providers allow api calls to be made with detailed structured output schemas.
The key properties of structured outputs are:
Explicit schema: Required fields, allowed values, and data types are defined upfront.
Deterministic parsing: The response can be programmatically parsed without heuristics.
Immediate validation: Invalid or incomplete outputs can be rejected before downstream use.
Reduced hallucination surface: The model is constrained to fill known fields rather than invent narrative text.
In effect, structured outputs turn an LLM call into something closer to a typed function call than a text-generation task.
Example: Structured output in an API call
Below is an example using a schema-enforced response where the model must identify an SRE investigation target.
POST /v1/chat/completions
  {
    "model": "gpt-4.1",
    "messages": [
      {
        "role": "system",
        "content": "You are an AI SRE assistant. Extract investigation details from the incident."
      },
      {
        "role": "user",
        "content": "Service validation is failing with error code 503 in us-west1 since 10:42 UTC."
      }
    ],
    "response_format": {
      "type": "json_schema",
      "json_schema": {
        "name": "incident_investigation",
        "schema": {
          "type": "object",
          "required": ["service_name", "error_code", "region", "start_time"],
          "properties": {
            "service_name": {
              "type": "string",
              "description": "Canonical service identifier"
            },
            "error_code": {
              "type": "string",
              "enum": ["500", "502", "503", "504"]
            },
            "region": {
              "type": "string",
              "pattern": "^[a-z]+-[a-z]+[0-9]+$"
            },
            "start_time": {
              "type": "string",
              "format": "date-time"
            }
          }
        }
      }
    }
  }
the response can be deterministically rejected and retried.
3. Using models to verify models
Although LLMs are non-deterministic, techniques such as consistency checks, cross-validation, and self-reflection have proven effective in practice. Redundancy can mitigate variance.
consistency checking: generate multiple independent responses (via re-sampling, prompt variation, or temperature sweeps) and compare them for agreement on critical fields. Disagreement is a strong signal of uncertainty and can be used to trigger retries, fallback logic, or human review.
Another effective technique is cross-validation using specialized prompts or models. For example, one model (or prompt) produces an answer, while another is tasked solely with verification—checking factual correctness, schema adherence, or alignment with known constraints. Importantly, the verifier’s scope should be narrower and more deterministic than the generator’s.
Self-reflection and critique loops further improve reliability. In this pattern, the model is explicitly asked to inspect its own output for errors, missing assumptions, or violations of constraints. While not foolproof, this often catches obvious inconsistencies, incorrect identifiers, and logical gaps before results propagate downstream.
4. Control context window size aggressively
Modern LLMs support extremely large context windows, which can lead to overconfidence in passing large volumes of data. Beyond a task and model-specific threshold, stuffing a lot of data into the context window can introduce additional non-determinism, increasing variance rather than accuracy, and raise hallucination risk.
The optimal token budget depends on the model and the task. The only reliable way to determine this limit is benchmarking: incrementally increase context size on a representative dataset and observe accuracy degradation.
Not all available information should be included. Minimizing irrelevant or weakly related context improves determinism and reduces the probability of spurious correlations.
Hallucination rate is one of the key accuracy metrics in our AI SRE evaluation framework. We scored safety and guardrails as one of six evaluation criteria in our best AI SRE Tools comparison. See how each platform approaches reasoning transparency and error handling.
Taming Non-Determinism in Agentic AI for Production Reliability
In summary, hallucinations are not anomalies; they are an expected property of probabilistic systems. The solution is not to hope for perfect models, but to apply disciplined systems engineering: testing, validation, structure, redundancy, and controlled inputs.
We announced in our previous blog that we are “meeting the developers in their backyard” with the launch of the Hawkeye MCP Server. In this blog, I want to show you a step-by-step demo of how to connect Hawkeye with Cursor IDE to dramatically improve the experience of responding to production issues.
Hawkeye is our AI SRE Agent that connects to endpoints using read-only API calls. This includes AWS, Azure, Grafana, GitHub, Datadog, and more. The agent autonomously investigates any alerts and incidents, then conducts a deep analysis of the connected metrics, events, logs, and traces. The result is accurate Root Cause Analysis (RCA) and remediation steps.
The agent is available to access using MCP, and it gives engineers a single point of entry for reasoning with deep contextual insights from the entire infrastructure and application stack. Let’s take a look at how this works in practice using Cursor.
Once Hawkeye is configured, take note of your username, password, and URL. Then, set them as environment variables in a terminal, replacing the respective strings with your own.
Launch Cursor from the same terminal so that it can inherit the variables. I will be showing the Cursor IDE example by running the ‘code’ command.
code
Note: If Cursor was open previously, you must fully exit the application and relaunch it from the command line to inherit the environment variables.
In the Cursor UI, go to Settings > Tools & MCP > Add Custom MCP (or + New MCP Server). Then, paste the following ‘hawkeye’ configuration to run a local MCP server.
Note: Remote MCP server with token-based authentication is coming soon.
In the Cursor MCP configuration under Installed MCP Servers, you should see a green circle with the number of tools listed for Hawkeye, which indicates a successful connection.
Investigate and Remediate Alerts
The following queries are examples of how you can interact with Hawkeye using MCP to retrieve alerts from connected sources, run an investigation, and fix issues using Hawkeye’s RCA and remediation steps.
List any uninvestigated alerts in Hawkeye and identify which one to address first
This prompt retrieves alerts from the chosen project in Hawkeye and references the metadata of the alerts to order them from highest to lowest priority.
Run an investigation on the critical alert and retrieve the RCA
This prompt runs an investigation on Hawkeye, which produces the RCA. The remediation steps and recommendations are now loaded into Cursor’s context.
Refer to the remediation steps from Hawkeye and create a Pull Request (PR) in GitHub with suggested changes
Cursor uses LLMs to generate a code change based on the RCA provided by Hawkeye.
With just these three prompts, I am able to get a detailed root cause analysis, remediation steps to fix the issue, improved alerting mechanism to catch more details, and a first commit towards a PR.
Now that you have access to our AI SRE Agent’s powerful context engineering across multiple environments, you can leverage it to automatically investigate issues such as:
What changed in the last 30 minutes across all environments that correlates with this latency spike?
Correlate this customer-reported issue with backend traces, logs, and infrastructure metrics for their request.
What’s the blast radius if this node/zone/region fails right now?
Once Hawkeye investigates the issue, you will get detailed remediation steps and recommendations that can be referenced by the LLM to create code and config changes. This brings you closer than ever to a fully automated lifecycle of incident creation to incident resolution, right in your development environment.
In the age of LLMs, it’s easy to build an AI agent that can do something. Wire up a prompt, call an API, and the demo looks great. It feels impressive – until you try to run it inside a real enterprise environment.
Because in enterprise environments, doing something isn’t enough. These environments are chaotic: telemetry is noisy, systems are fragmented, and stakes are high. In this world, most AI agents collapse under pressure.
Why? Because they lack one critical capability: contextual understanding. The difference between a toy agent and one that performs under pressure comes down to a single idea: context.
And in production, context doesn’t come from a prompt. It comes from context engineering – a discipline most teams are only beginning to understand.
Most Agents Don’t Fail Because the Model Is Weak
They fail because the context is. LLMs are capable of advanced reasoning – but only when you feed them the right inputs. In enterprise IT, that’s no small feat. You’re dealing with:
Unstructured, deeply nested logs
High-volume, high-dimensional metrics
Distributed traces across async systems
Alerts based on thresholds, not causality
Constantly changing configs
Feed that into a model naively, and you don’t get insight. You get noise.
What Is Context Engineering?
Context engineering is the discipline of transforming raw data into structured, relevant, and task-specific input for an AI agent.
It’s about designing what the agent should see – and more importantly, what it shouldn’t. It’s about curating the right data, in the right format, at the right time.
That includes:
Pulling the right logs, not just the most recent ones
Extracting signal from high-volume metrics without flooding the model
Aligning traces, configs, and events into coherent timelines
Framing input to reflect how real engineers debug incidents
It’s surgical. And it’s what enables agents to reason instead of react.
Why This Matters for Enterprise AI Agents
Agents that operate in production environments need more than LLM wrappers and chatbot UIs.
They need the ability to trace causality across signals, awareness of architecture and deployment shifts, and contextual reasoning that mirrors how SREs think under pressure.
This requires more than a model. It requires a context engine—a system that filters, aligns, and sequences telemetry to make reasoning possible.
At NeuBird, this principle shaped how we built our AI SRE agent. And it’s the foundation for what we believe all enterprise-grade agents will need to evolve: with context as the first-class input, not an afterthought.
Context Engineers: The Builders Behind the Curtain
This shift demands a new kind of builder: the context engineer.
Context engineers aren’t prompt tuners or ML ops specialists – they’re systems thinkers. For enterprise IT operations, these would be people who’ve been on-call, traced issues across stacks, and know what real production debugging looks like. They build pipelines that:
Curate high-value context from raw telemetry
Normalize inputs across heterogeneous systems
Model the investigative paths that SREs actually follow
Translate infrastructure knowledge into structured, machine-readable form
They’re not just enabling the agent to respond. They’re teaching it to think.
Enterprise AI Will Be Built on Context
Everyone’s racing to build agents. But very few are building ones that truly understand the enterprise.
If your agent isn’t context-aware, it’s just reacting to symptoms. If it can’t reason across telemetry, it’s not doing RCA. If it doesn’t have engineered context, it’s not ready for production.
Read more: We used context engineering as one of six evaluation criteria in our AI SRE Tools guide. The divide is clear: platforms that query live telemetry at investigation time vs. those working from pre-indexed snapshots produce fundamentally different results.
The future of enterprise AI will be shaped not by who uses the biggest model – but by who delivers the most relevant, structured, and actionable context to it.
That’s context engineering. And that’s what makes the difference between a great demo and an enterprise grade agent.
A joint post from the teams at NeuBird and Confluent
For organizations running managed Confluent, the company behind Apache Kafka® as a central nervous system for their data, ensuring smooth operations is mission-critical. While Confluent Cloud eliminates much of the operational burden of managing Kafka clusters, application teams still need to monitor and troubleshoot client applications connecting to these clusters.
Traditionally, when issues arise—whether it’s unexpected consumer lag, authorization errors, or connectivity problems—engineers must manually piece together information from multiple observability tools, logs, and metrics to identify root causes. This process is time-consuming, requires specialized expertise, and often extends resolution times.
Today, we’re excited to share how NeuBird, a GenAI-powered SRE assistant, is transforming this experience by automating the investigation and resolution of Confluent Cloud incidents—allowing your team to focus on innovation rather than firefighting.
The Foundation: Kafka Client Observability with Confluent
Confluent’s observability setup provides a strong foundation for monitoring Kafka clients connected to Confluent Cloud. It leverages:
A time-series database (Prometheus) for metrics collection
Client metrics from Java consumers and producers
Visualization through Grafana dashboards
Failure scenarios to learn from and troubleshoot
The demo is incredibly valuable for understanding how to monitor Kafka clients and diagnose common issues, but it still relies on human expertise to interpret the data and determine root causes.
Enhancing the Experience with Kubernetes and AI-driven Automated Incident Response
NeuBird builds on Confluent’s robust observability foundation by integrating, our GenAI-powered SRE, directly into the Kafka monitoring ecosystem. This combination goes beyond monitoring to introduce intelligent, automated incident response, significantly reducing Mean Time to Resolution (MTTR).
Here’s how NeuBird augments Confluent’s observability with three significant improvements:
Kubernetes Deployment: We’ve containerized the entire setup and made it deployable on Kubernetes (EKS), making it more representative of production environments and easier to deploy.
Alert Manager Integration: We’ve added Prometheus Alert Manager rules that trigger PagerDuty incidents, creating a complete alerting pipeline.
Audit Logging: We’ve expanded the telemetry scope to include both metrics and logs in CloudWatch, giving a more comprehensive view of the environment.
Most importantly, we’ve integrated NeuBird’s GenAI-powered SRE, to automatically investigate and resolve incidents as they occur, significantly reducing Mean Time to Resolution (MTTR).
Seeing it in Action: Authorization Revocation Scenario
Let’s walk through a real-world scenario from the Confluent demo: the “Authorization Revoked” case, where a producer’s permission to write to a topic is unexpectedly revoked.
The Traditional Troubleshooting Workflow
In the original demo workflow, here’s what typically happens:
An engineer receives an alert about producer errors
They log into Grafana to check producer metrics
They notice the Record error rate has increased
They check Confluent Cloud metrics and see inbound traffic but no new retained bytes
They examine producer logs and find TopicAuthorizationException errors
They investigate ACLs and find the producer’s permissions were revoked
They restore the correct ACLs to resolve the issue
This manual process might take 15-30 minutes for an experienced Kafka engineer, assuming they’re immediately available when the alert triggers.
The Neubird-Automated Workflow
With our enhanced setup including Neubird, the workflow is transformed:
Prometheus Alert Manager detects increased error rates and triggers a PagerDuty incident
Neubird automatically begins investigating the issue by:
Retrieving and analyzing producer metrics from Prometheus
Correlating with Confluent Cloud metrics
Examining producer logs for error patterns
Checking AWS CloudWatch for audit logs showing ACL changes
Within minutes, Neubird identifies the TopicAuthorizationException and links it to recent ACL changes
Neubird generates a detailed root cause analysis with specific remediation steps
An engineer reviews Neubird’s findings and applies the recommended fix (or optionally, approves Neubird to implement the fix automatically)
The entire process is reduced to minutes, even when the issue occurs outside business hours. More importantly, your specialized Kafka engineers can focus on more strategic work rather than routine troubleshooting.
Demo Video
In this video, we demonstrate the complete workflow:
How we deploy the enhanced Confluent observability solution to Kubernetes
Triggering the authorization revocation scenario
Watching Neubird AI SRE automatically detect, investigate, and diagnose the issue
Reviewing Neubird’s detailed analysis and remediation recommendations
Implementing the fix and verifying the resolution
The Technical Architecture
Our enhanced solution builds upon Confluent’s observability foundation with several key components:
Kubernetes Deployment: All components are packaged as containers and deployed to EKS using Helm charts, making the setup reproducible and scalable.
Prometheus and Alert Manager: We’ve added custom alerting rules specifically designed for Confluent Cloud metrics and common failure patterns.
AWS CloudWatch Integration: Both metrics and logs are forwarded to CloudWatch, providing a centralized location for all telemetry data.
Neubird Integration: Neubird connects securely to your telemetry sources with read-only permissions, leveraging GenAI to understand patterns, correlate events, and recommend precise solutions.
The architecture respects all security best practices—Neubird never stores your telemetry data, operates with minimal permissions, and all analysis happens in ephemeral, isolated environments.
Real-World Impact
Organizations using Neubird with Confluent Cloud have seen significant operational improvements:
Reduced MTTR: Issues that previously took hours to diagnose are now resolved in minutes
Decreased Alert Fatigue: Engineers are only engaged when human intervention is truly needed
Knowledge Democratization: Teams less familiar with Kafka can confidently operate complex Confluent Cloud environments
Improved SLAs: With faster resolution times, application availability and performance metrics improve
As one example, an enterprise IT storage company reduced their MTTR for DevOps pipeline failures by implementing Neubird. When experiencing a crash loop with one of their applications causing production downtime, Neubird automatically picked up the alert from PagerDuty, investigated the issue, and determined that the crashes were happening due to a recent application deployment. Neubird recommended which specific application and process needed to be rolled back, dramatically reducing resolution time.
Getting Started
Want to try this enhanced observability setup with your own Confluent Cloud environment? Here’s how to get started:
Check out our GitHub repository for the Kubernetes-ready version with Prometheus Alert Manager rules
Schedule a demo to see Neubird AI in action with your Confluent Cloud environment
Conclusion
The combination of Confluent Cloud and Neubird’s AI represents a powerful shift in how organizations operate Kafka environments. By leveraging Confluent’s rich telemetry data and Neubird’s GenAI-powered automation, teams can significantly reduce operational overhead, improve reliability, and focus on delivering value rather than troubleshooting infrastructure.
As data streaming becomes increasingly central to modern applications and with availability of fully managed Kafka and Flink solutions in Confluent Cloud, this type of intelligent automation will be essential for scaling operations teams effectively—letting them support larger, more complex deployments without proportionally increasing headcount or sacrificing reliability.
We’re excited to continue innovating at the intersection of observability, AI, and data streaming. Let us know in the comments how you’re approaching observability for your Confluent Cloud environments!