Debugging OpenShift Network Policy Failures with NeuBird AI
NetworkPolicy failures are one of the most operationally expensive failure modes in OpenShift. NeuBird AI debugs these invisible failures by correlating policy changes with traffic impact across namespaces.

The incident that costs you four hours started with a three-line policy change nobody flagged.
The Invisible Failure Mode
NetworkPolicy failures are one of the most operationally expensive failure modes in OpenShift. Not because they're technically complex, but because the failure almost never surfaces where the change was made.
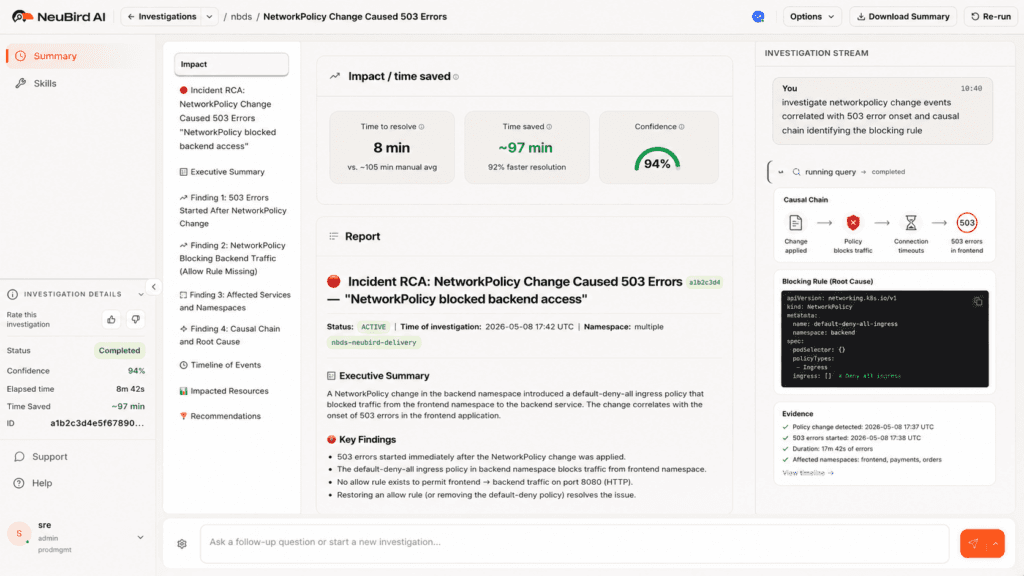
A platform team adds a default-deny-all NetworkPolicy to a shared services namespace during a compliance audit. It looks correct. It's scoped right. Twenty minutes later, six downstream teams are opening incidents. Their applications are throwing 503s. Database connection pools are exhausted. SREs are paging on-call engineers, all of them staring at logs that say "upstream connection refused" and "dial tcp: i/o timeout" with no further explanation.
Nobody is looking at the policy change. Nobody even knows it happened yet.
This is a visibility problem, not a complexity problem. OpenShift's security model, including SCCs, NetworkPolicies, and OVN-Kubernetes, is correct and necessary. Multi-tenant platforms running financial workloads, healthcare data, or regulated services require strict policy enforcement. The problem is that the tooling available to debug policy-driven failures hasn't kept pace with the density of policy changes that come with operating OpenShift at scale.
When one policy change can silently affect six namespaces owned by different teams, the operational cost of finding that connection is measured in engineering hours, not minutes. This post walks through how that debugging actually goes, what makes it hard, and how AI-driven investigation changes the equation.
How NetworkPolicy Works in OpenShift (and Why Failures Hide)
OpenShift 4.x ships with OVN-Kubernetes as its default CNI plugin, replacing the older OpenShift SDN, which is now deprecated. Understanding how OVN-Kubernetes enforces NetworkPolicy is essential to understanding why failures are so opaque from the application side.
The Enforcement Layer
NetworkPolicy objects define ingress and egress rules using label selectors. A policy says: pods with label app=frontend in namespace checkout may receive traffic from pods with label app=api-gateway in namespace platform. Everything else is denied. These policies are translated by OVN-Kubernetes into ACL (Access Control List) rules inside the OVN database and enforced at the node level, in the kernel's flow tables.
This enforcement is completely invisible to application logs. When traffic is blocked, the packet is dropped at the node. The source pod sees a timeout. The destination pod never sees the connection attempt. Neither pod logs anything about a network policy. They log what they observe: connection refused, timeout, upstream unreachable.
Default-Deny and Its Consequences
A common compliance requirement is to apply a default-deny-all ingress and egress policy to namespaces that handle sensitive data. This is sound security posture. The problem is that in a running multi-tenant cluster, the full set of traffic paths is rarely fully documented. There are shared services, monitoring agents, internal API gateways, service mesh control plane traffic, and observability sidecars, all of which require explicit allow rules to function after a default-deny policy is applied.
A concrete example: a platform team hardening a shared authentication service namespace applies a default-deny-all NetworkPolicy followed by allow rules for the three consumer namespaces they know about. Six consumer namespaces exist. Three of them were undocumented. Those three immediately begin seeing authentication failures, which cascade into application-level 503s and database connection pool exhaustion as retry loops saturate the connection limit.
The platform team won't know this happened until the incident tickets reach them, which typically takes 15 to 30 minutes after the alerts fire. By that point, multiple teams are in parallel debugging sessions, all looking at the wrong layer.
The Label Mismatch Problem
Even when the correct namespaces are included in a policy, label selectors can fail silently. If a policy selects pods using app=auth-service but the pods are labeled app=auth, the traffic is blocked. oc describe networkpolicy will show the policy as valid. The problem only becomes visible when you trace it to the specific pod labels, which requires checking the policy, the pods, and the traffic path in combination.
OVN-Kubernetes adds another layer: the ACL rules generated from a policy may span multiple logical switch ports, and the effective policy applied to a given pod depends on the union of all policies in that namespace plus cluster-level NetworkPolicies if they exist. A policy that appears to allow traffic may be overridden by another policy in the same namespace that has a stricter deny.
The result is a debugging problem that requires correlating events across multiple namespaces, change history, pod labels, and traffic flows simultaneously. Standard tooling surfaces each of these individually. The connection between them requires manual assembly.
The Standard Debugging Workflow (and Its Limits)
Here is what engineers actually do when a NetworkPolicy failure presents as application errors.
Step 1: Check pod logs in the affected namespace. The logs show "upstream connection refused," "dial tcp: connection timed out," or "EOF." These are symptoms, not causes. Nothing in the logs indicates a network policy is involved.
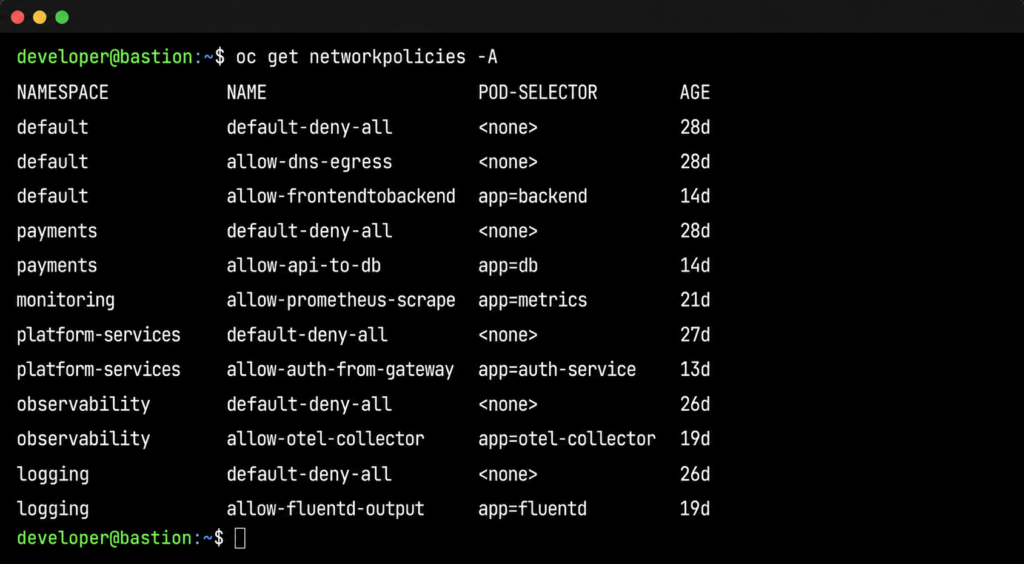
Step 2: Check NetworkPolicies in the affected namespace. oc get networkpolicies -n <failing-namespace> shows the policies applied to the consuming namespace. Unless the consuming namespace has an overly restrictive egress policy, nothing here explains the failure. The problem is in a different namespace, but there's no signal pointing there yet.
Step 3: Start expanding the search. The engineer begins checking other namespaces: oc get networkpolicies -n <namespace> repeated across five, ten, twenty namespaces. oc describe networkpolicy <policy-name> -n <namespace> to examine rules. This is manual, sequential, and relies on the engineer knowing which namespaces to check.
Step 4: Trace the traffic path. What pods need to talk to what services, across which namespaces? In a well-documented system, this is straightforward. In a multi-tenant cluster that has evolved over two years, it often isn't. Service mesh telemetry can help here if it's available and the engineer knows to look there.
Step 5: Packet capture. If steps 1 through 4 haven't identified the issue, the engineer reaches for oc debug node/<node-name> and runs tcpdump to capture traffic at the node level. This confirms whether packets are being dropped at the network layer. It doesn't tell you which policy is dropping them.
Step 6: Cross-reference with change history. At some point, the engineer starts asking: what changed recently? This means querying GitOps history, checking change management tickets, or asking team members what was deployed in the last hour. This step is often the one that finally surfaces the policy change, but it depends on someone knowing to ask the question.
The problem with this workflow is not that any individual step is wrong. It's that steps 1 through 4 can consume an hour before the engineer is even looking at the right namespace. In a cluster with 50 namespaces and overlapping policies, manually mapping the blast radius of a single bad policy is time-intensive work that requires institutional knowledge about which services depend on which other services.
The other cost is team fragmentation. When the consuming namespace and the policy namespace are owned by different teams, the incident can stay in the wrong team's queue for a long time. The team that applied the policy has no alert telling them something broke. The team seeing the 503s doesn't have access to the other team's namespace. The investigation stalls at organizational boundaries.
What NeuBird AI Does Differently
The fundamental problem with NetworkPolicy debugging is that it requires correlating three things that live in three different places, none of which points at the others.
- The policy change event: who changed what, when, in which namespace. This lives in GitOps history or change management records.
- The traffic impact: which services started failing, at what time, with what error patterns. This lives in Prometheus metrics and Loki logs.
- The dependency map: which namespaces and services need to communicate with each other. This lives in OpenShift cluster state and service mesh telemetry.
A human engineer with enough time and access can assemble these three things manually. NeuBird AI's Agent Context Engine (ACE) assembles them automatically, across namespace boundaries, in the time it takes to read an alert notification.
How the Investigation Works
When services in namespace B begin returning 503s, NeuBird AI opens an investigation and does the following in parallel, not sequentially.
First, it correlates the failure onset timestamp with recent NetworkPolicy changes across all namespaces in the cluster. Not just the failing namespace. All of them. This is the step that breaks the manual workflow: NeuBird AI doesn't need someone to know which namespace to look in.
Second, it identifies that a NetworkPolicy change in namespace A (the shared services namespace) preceded the failure onset by four minutes. This is the causal candidate.
Third, it maps the dependency graph. It knows that namespace B's payment service makes outbound calls to namespace A's authentication service, based on service mesh telemetry and historical traffic data. That traffic path is now covered by a default-deny-all policy in namespace A that has no corresponding allow rule for namespace B.
Fourth, it surfaces the specific policy, the specific rule, and the remediation. The blocking rule is identified by name. The fix is explicit: add a NetworkPolicy in namespace A allowing ingress from namespace B's payment service pods, selected by label app=payment-service.
This is the difference between correlation and causation. Correlation tells you that 503s and a policy change happened around the same time. Causation, which NeuBird AI delivers, tells you that the policy change blocked a specific traffic path, which pods are affected, and exactly what to change to restore service.
FalconClaw Skills for Network Policy Enforcement
NeuBird's FalconClaw skills hub extends this investigation with organization-specific knowledge. Platform teams can encode their own NetworkPolicy standards: required allow rules for monitoring agents, known-good policy templates for compliance namespaces, dependency maps for critical shared services.
When a new policy is applied that would violate those standards, FalconClaw fires before the traffic is affected. When an investigation surfaces a policy violation, FalconClaw can cross-reference against the organization's documented standards to identify whether this is a known pattern or a novel misconfiguration.
Teams that have codified their network topology in FalconClaw skills get investigations that run against their actual dependency map, not a generic inference. The result is faster root cause identification in environments that have been operating for years and have accumulated undocumented dependencies.

The Numbers
NeuBird AI delivers 94% root cause accuracy, 78% reduction in alert noise, and up to 90% faster MTTR in production environments. For a NetworkPolicy failure that would otherwise consume two to four hours of SRE time across multiple teams, the investigation resolves in minutes. The teams that were in separate debugging sessions can close their incidents. The platform team sees the change and its impact together.
Prevention and Continuous Visibility
Finding failures faster is valuable. Not having them surface as production incidents is better.
NeuBird AI monitors cluster state continuously. When a new NetworkPolicy is applied, it evaluates the change against the live dependency map. If the policy would create a default-deny situation that blocks traffic paths currently in use, it fires an alert before the traffic is affected. The platform team knows the blast radius of the change before they apply it.
This is particularly useful for compliance-driven hardening passes, where the goal is to apply restrictive policies without breaking existing services. Currently, the standard approach is to apply the policy in a non-production environment and observe. That works when the non-production environment accurately reflects production traffic patterns, which it often doesn't. NeuBird AI's dependency map reflects actual production traffic, so the blast radius prediction is based on what is actually running, not what is documented.
NeuBird AI also detects in-progress failures that don't yet have an obvious cause. When connection error rates in a namespace spike in a pattern consistent with a policy enforcement change (sudden onset, affecting all pods in a namespace uniformly, no application-level change events), NeuBird AI flags it as a policy candidate before the manual investigation begins. Engineers enter the debugging workflow already looking at the right layer.
The third piece is ongoing visibility into policy coverage. Which namespaces have default-deny policies? Which traffic paths are relying on implicit allow behavior that would break if a default-deny policy were added? NeuBird AI maintains this map continuously, so the answer is always current, not a snapshot from the last time someone ran a manual audit.
For platform teams managing hardened multi-tenant OpenShift environments, this level of visibility is the difference between network policy being a security tool and a liability.
Start Debugging Faster
NetworkPolicy failures will keep happening. Compliance requirements drive policy changes, and policy changes introduce risk that the standard tooling can't surface quickly enough. The operational cost is real: engineering hours, cross-team coordination overhead, and the customer-facing impact of failures that take too long to find.
NeuBird AI cuts that time by correlating the three things that manual debugging assembles slowly: the change event, the traffic impact, and the dependency map. The result is root cause in minutes, not hours, with a specific fix, not a theory.
Try NeuBird AI free: Book a demo
Hands-on playground: neubird.ai/playground. Try investigating a live NetworkPolicy failure in a real OpenShift-like environment. No setup, just your email.