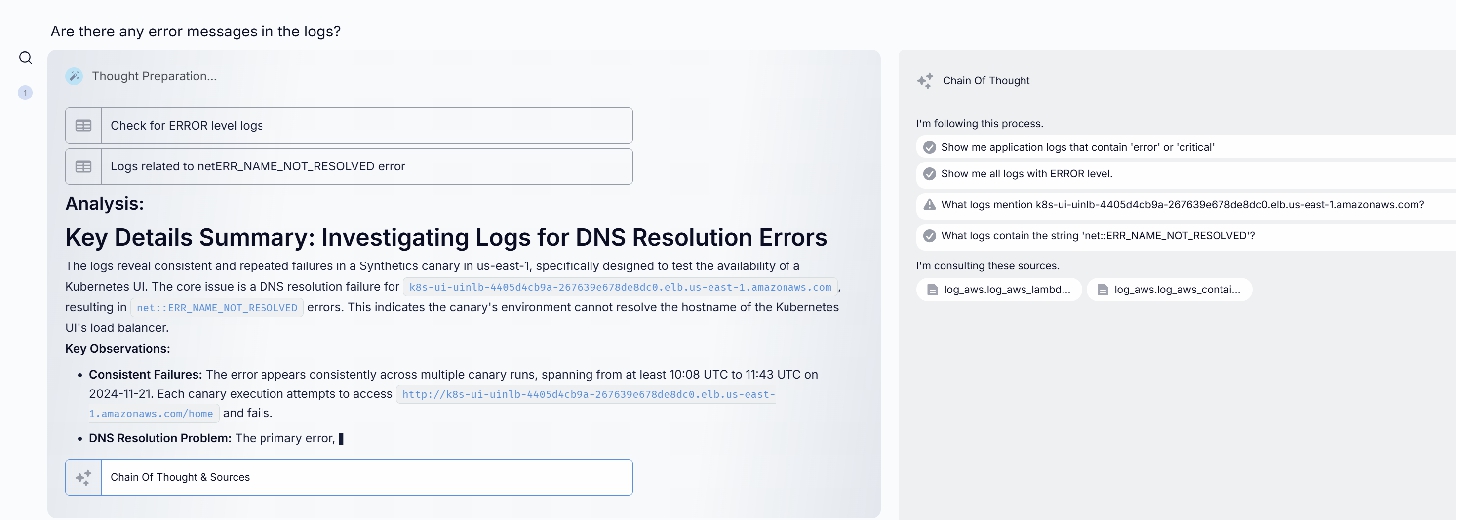
How SRE teams are automating container deployment investigations with Hawkeye
Your team just deployed a new feature to production when PagerDuty alerts: “Maximum pod_container_status_waiting_reason_image_pull_error GreaterThanThreshold 0.0”. What should have been a routine deployment has turned into a complex investigation spanning multiple AWS services, container registries, and Kubernetes components.
The Modern Image Pull Investigation
Today’s container deployment issues occur in environments with sophisticated observability stacks. CloudWatch diligently logs every container event, Prometheus tracks your deployment metrics, and your CI/CD pipeline maintains detailed records of every build and deployment. Yet when image pull errors occur, this wealth of information often adds complexity to the investigation rather than simplifying it.
A typical troubleshooting session starts in your Kubernetes dashboard or CLI, where you see the ImagePullBackOff status. CloudWatch logs show the pull attempt failures, but the error messages can be frustratingly vague – “unauthorized” or “not found” don’t tell the whole story. You begin a methodical investigation across multiple systems:
First, you check AWS ECR to verify the image exists and its tags are correct. The image is there, but is it the version you expect? You dive into your CI/CD logs to confirm the build and push completed successfully. The pipeline logs show a successful push, but to which repository and with what permissions?
You switch to IAM to review the node’s instance role and its ECR policies. Everything looks correct, but when did these credentials last rotate? Back to CloudWatch to check the credential expiration timestamps. Meanwhile, you need to verify the Kubernetes service account configurations and secret mappings.
Each system provides critical pieces of the puzzle, but connecting them requires constant context switching and mental correlation of timestamps, configurations, and events across multiple AWS services and Kubernetes components.
Why Image Pull Errors Defy Quick Analysis
The complexity of modern container deployment means that image pull errors rarely have a single, obvious cause. Instead, they often result from subtle interactions between multiple systems:
An ECR authentication token might be valid, but the underlying instance role could be missing permissions. The Kubernetes secrets might be correctly configured, but the node might be pulling from the wrong registry endpoint. Network security groups and VPC endpoints add another layer of potential complications.
Your observability tools capture the symptoms across all these systems, but understanding the sequence of events and identifying the root cause requires simultaneously analyzing multiple authentication flows, networking paths, and permission boundaries.
Hawkeye: Your Deployment Detective
Here’s how Hawkeye transforms this investigation:
The Hawkeye Difference
What sets Hawkeye apart isn’t just its ability to check permissions or validate configurations – it’s how it analyzes the complex interactions between AWS services, Kubernetes components, and your deployment pipeline simultaneously. While an SRE would need to manually switch between ECR, IAM, CloudWatch, and Kubernetes tooling to piece together the authentication flow, Hawkeye processes all these systems in parallel to quickly identify where the chain breaks down.
Read more: Beyond deployment troubleshooting, a comprehensive monitoring strategy is essential. Learn how to move beyond static Kubernetes dashboards with Grafana, Prometheus and AI-enhanced observability.
This parallel analysis capability allows Hawkeye to uncover cause-and-effect relationships that might take hours for humans to discover. By simultaneously examining IAM policies, ECR authentication flows, network configurations, and Kubernetes events, Hawkeye can trace how a seemingly minor infrastructure change can cascade into widespread deployment failures.
Real World Impact
For teams using Hawkeye, the transformation extends beyond faster resolution of image pull errors. Engineers report a fundamental shift in how they approach container deployment reliability:
Instead of spending hours jumping between different AWS consoles and Kubernetes tools during incidents, they can focus on implementing systematic improvements based on Hawkeye’s comprehensive analysis. The mean time to resolution for image pull failures has dropped dramatically, but more importantly, teams can prevent many issues entirely by acting on Hawkeye’s proactive recommendations for authentication and permission management.
Implementation Journey
Integrating Hawkeye into your Kubernetes environment is straightforward:
Connect your existing observability tools – Hawkeye enhances rather than replaces your current monitoring stack
Configure your preferred incident response workflows
Review Hawkeye’s incident analysis, drill down with questions, and implement recommendations.
Scale your team and improve morale by transforming your approach to application debugging from reactive investigation to proactive improvement. Let Hawkeye handle the complexity of Image Pull Error analysis while your team focuses on innovation.
“Just tune your alert thresholds better.” “Set up more sophisticated routing rules.” “Create better runbooks.”
If you’re an SRE dealing with alert fatigue, you’ve heard these suggestions before. Yet despite years of refinement, most teams still face a fundamental challenge: the volume and complexity of alerts continue to outpace our ability to handle them effectively. Traditional approaches to alert management are hitting their limits—not because they’re poorly implemented, but because they’re solving the wrong problem.
The issue isn’t just about routing alerts more efficiently or documenting better runbooks. It’s about the fundamental way we approach incident response. When a critical Splunk alerttriggers a PagerDuty notification at 3 AM, the real problem isn’t the alert itself—it’s that a human has to wake up and spend precious time gathering context, analyzing logs, and determining the right course of action.
Beyond Alert Automation: The Current Reality
Today’s incident response stack is sophisticated. Splunk’s machine learning capabilities can detect anomalies in real-time, while PagerDuty’s intelligent routing ensures alerts reach the right people. Yet the reality in most enterprises is far more complex. Different teams often prefer different tools, leading to scenarios where application logs might live in Splunk, while cloud metrics flow to CloudWatch, and APM data resides in Datadog.
This fragmentation means that when an alert fires, engineers must:
Acknowledge the PagerDuty notification
Log into multiple systems
Write and refine Splunk queries
Correlate data across platforms
Document findings
Implement solutions
All while the clock is ticking and services might be degraded.
The Standard Integration Methods: Common Splunk & PagerDuty Approaches
Splunk Webhook to PagerDuty
Splunk triggers real-time alerts to PagerDuty via webhooks by configuring an alert action to send payloads to the PagerDuty Events API using an integration key. Setting it up is straightforward, but mapping detailed Splunk data (e.g., log context) to PagerDuty’s limited incident fields can be clunky, often requiring manual tweaks. Combining Splunk’s rich telemetry with PagerDuty’s escalation creates a reactive feedback loop, though it lacks the insights SRE teams need.
PagerDuty Events API Integration
Splunk leverages PagerDuty’s Events API to push customized event data—severity, source, or metrics—via scripted REST calls, enabling dynamic incident management. The difficulty lies in scripting complexity and error handling, as API rate limits or malformed payloads can disrupt workflows, demanding ongoing maintenance. This integration merges Splunk’s diagnostics with PagerDuty’s response orchestration, offering deeper incident context than standalone tools.
PagerDuty Data Ingestion into Splunk
Splunk pulls PagerDuty incident logs via the PagerDuty Add-on or REST inputs, enabling correlation with system metrics and logs for after-the-fact analysis. The challenge is managing data volume and latency—API polling can lag, and parsing unstructured incident data into Splunk’s schema takes effort. This method fuses PagerDuty’s operational history with Splunk’s analytics, providing a fuller picture of incidents.
Splunk Alert Action with PagerDuty App
The PagerDuty App for Splunk embeds an alert action to route Splunk alerts to PagerDuty services, auto-creating incidents with links back to Splunk after a simple key-based setup. While user-friendly, it struggles with customization—teams often hit limits when trying to enrich incidents beyond basic fields, requiring workarounds.
Third-Party Middleware (e.g., AWS Lambda)
A middleware like AWS Lambda processes Splunk alerts and pushes them to PagerDuty with tailored logic, bridging the two platforms flexibly. Setup is complex—teams must handle Lambda coding, security, and potential delays, making it resource-intensive. Combining data this way offers granular control and richer insights, but it’s still a manual bridge.
Hitting the Limits: Challenges with Conventional PagerDuty Splunk Integrations
Even with standard integrations in place, organizations run into issues.
Fragmented Data and Context
Basic integrations often result in siloed information, forcing engineers to manually correlate logs with alerts across multiple platforms.
Static and Rigid Workflows
Predefined rules in global event routing or direct integrations can struggle with dynamic environments, leading to misrouted alerts or delayed responses.
High Maintenance Overhead
Legacy integrations and custom scripts require continuous updates to adapt to changing IT landscapes, consuming valuable time and resources.
Limited Intelligence
Traditional setups lack the capability to analyze historical data or generate actionable insights, leaving SREs with a fragmented picture that delays effective resolution.
Meet Hawkeye: Bridging the Gap with Generative AI for Splunk ServiceNow Integration
Consider a fundamentally different approach. Instead of humans serving as the integration layer between tools, Hawkeye acts as an intelligent orchestrator that not only bridges Splunk and PagerDuty but can pull relevant information from your entire observability ecosystem. This isn’t about replacing any of your existing tools—it’s about having a GenAI powered SRE that maximizes their collective value and helps your team deliver results and scale.
Beyond Simple Integration: How Hawkeye Improves PagerDuty and Splunk
When a critical alert fires, Hawkeye springs into action before any human is notified. It automatically:
Analyzes Splunk logs using sophisticated SPL queries
Correlates patterns across different time periods
Gathers context from other observability tools
Prepares a comprehensive incident analysis
Recommends specific actions based on historical success patterns
This happens in seconds, not the minutes or hours it would take a human engineer to manually perform these steps. More importantly, Hawkeye learns from each incident, continuously improving its ability to identify root causes and recommend effective solutions.
Transforming Splunk and PagerDuty Incident Management and Response Workflow
The transformation in daily operations is profound. Instead of starting their investigation from scratch when a PagerDuty alert comes in, engineers receive a complete context package from Hawkeye, including:
Relevant log patterns identified in Splunk
Historical context from similar incidents
Correlation with other system metrics
Specific recommendations for resolution
This shifts the engineer’s role from data gatherer to strategic problem solver, focusing their expertise where it matters most.
Unlocking Actionable Insights with Effective AI Prompting for Splunk and PagerDuty
“Talking” to an AI SRE teammate like Hawkeye requires asking and prompting the right questions. In a PagerDuty environment, consider AI prompts that help you understand incident response dynamics:
You might prompt GenAI “Which incidents are at risk of breaching their SLA targets?” or “Who is currently on-call for my critical services?”. Similarly, for your PagerDuty escalation management, think about optimizing alert workflows or balancing on-call rotations, all of which are crucial for maintaining operational efficiency. Learn more in our PagerDuty prompting guide.
On the Splunk side, the focus shifts to data-driven insights. Prompts like “What are the most common error types in the last 7 days?” or “Which searches are consuming the most resources?” give you a deeper understanding of your log patterns to identify anomalies. Learn more in our Splunk prompting guide.
The Future of SRE Work: From Survival to Strategic Impact
The transformation Hawkeye brings to SRE teams extends far beyond technical efficiency. Hawkeye automates routine investigations and provides intelligent analysis across your observability stack, multiplying the capacity of your existing team, meaning you can handle growing system complexity without proportionally growing headcount. More importantly, it transforms the SRE role itself, addressing many of the factors that drive burnout and turnover:
Engineers spend more time on intellectually engaging work like architectural improvements and capacity planning, rather than repetitive investigations.
The dreaded 3 AM wake-up calls become increasingly rare as Hawkeye handles routine issues.
New team members come up to speed faster, learning from Hawkeye’s accumulated knowledge base.
For organizations, this translates directly to the bottom line through reduced recruitment costs, higher retention rates, and the ability to scale operations without scaling headcount.
Real Impact, Real Results
Early adopters of this approach are seeing dramatic improvements:
Reduction in mean time to resolution
Fewer escalations to senior engineers
More time for strategic initiatives
Improved team morale and retention
Better documentation and knowledge sharing
How to Begin
Implementing Hawkeye alongside your existing tools is a straightforward process that begins paying dividends immediately. While this blog focuses on Splunk and PagerDuty, Hawkeye’s integration capabilities mean you can connect it to your entire observability stack, creating a unified intelligence layer across all your tools.
Adding Hawkeye into your observability stack is easy:
Set up read-only connections to Splunk and PagerDuty.
Start a project within Hawkeye, linking your data sources.
Start interactive investigations, using real-time insights.
Ready to experience the power of GenAI for your incident management workflows? Check our demo or contact us to see how Hawkeye can become your team’s AI-powered SRE teammate.
FAQ
What is Splunk used for?
Splunk excels at capturing, indexing, and correlating machine-generated data – logs, metrics, traces – turning raw information into valuable insights. It’s a powerhouse for:
Security Information and Event Management: Detecting and responding to security threats.
IT Operations Management: Monitoring infrastructure and application performance.
Business Analytics: Uncovering trends and patterns to drive better decision-making.
PagerDuty delivers enterprise-grade incident management capabilities, enabling organizations to orchestrate the ideal response to any operational disruption. It provides:
Incident Response Automation: Streamlining resolution workflows to minimize service impact.
Strategic On-call Management: Implementing intelligent scheduling to maintain team effectiveness.
Service Level Monitoring: Ensuring consistent adherence to performance objectives across digital services. Learn more.
What is the difference between Splunk and PagerDuty? Should I use PagerDuty vs Splunk?
While both tools are crucial for incident management, they serve different primary functions. PagerDuty excels in incident response and on-call management, offering features like smart automation for alert grouping and routing. Splunk, on the other hand, focuses on data analytics and log management, providing advanced capabilities in anomaly detection and predictive analytics.
How forward-thinking SRE teams are revolutionizing incident response with Hawkeye
Every minute matters in incident response. Yet SRE teams spend, on average, 23 minutes just gathering context before even starting to solve the problem. For a team handling dozens of incidents each week, this adds up to hundreds of hours spent collecting data, time that could be used for strategic improvements.
This issue persists despite using powerful tools like Datadog and PagerDuty. While Datadog provides wide visibility and PagerDuty ensures notifications reach the right people, teams still struggle with slow response times and burnout. The problem lies in how we’re using these tools, and the fact that most organizations have multiple observability tools, meaning engineers rarely have all the information they need when a PagerDuty alert shows up.
The Current Landscape: Powerful Tools, Fragmented Response
Today’s incident management setup is advanced, with PagerDuty handling on-call schedules and escalation, while Datadog provides real-time monitoring and alerts. Together, they’re meant to be a solid base for incident response.
However, companies often have tool sprawl, leading to application metrics being tracked in Datadog while infrastructure logs are sent to CloudWatch. When an alert fires, engineers have to navigate this complex setup, often under pressure to fix things quickly.
The Standard Integration Methods: Common Datadog & PagerDuty Integration Approaches
Before exploring how GenAI transforms this landscape, let’s understand the common Datadog PagerDuty integration methods organizations typically implement:
Integration via PagerDuty Service (Direct Service-Level Integration)
Connects Datadog monitors directly to specific PagerDuty services using integration keys. You may configure Datadog to send alerts to PagerDuty using the @pagerduty-ServiceName syntax in monitor notifications. While the Datadog monitor PagerDuty integration is simple to set up, it doesn’t add much extra context and requires separate configuration for each service.
Global Event Routing (Event Orchestration)
More advanced teams use PagerDuty’s Global Event Routing to dynamically route Datadog monitor alerts based on content, tags, or severity. This offers more flexibility but still needs manual setup and maintenance.
API-Based Integration for Custom Workflows
Organizations that need control over their Datadog PagerDuty workflow often build custom integrations using both platforms’ APIs. This allows complex routing but takes a lot of development work and maintenance resources.
Datadog Apps Integration (UI Extensions)
PagerDuty’s UI extensions let engineers view and manage PagerDuty incidents right within Datadog dashboards, reducing the need to switch between tools. This helps responders stay within a single interface but doesn’t address the fundamental information gathering challenge.
Challenges with Conventional Datadog PagerDuty Integrations
Even with these integration options, SRE teams face issues:
Alert Noise and Context Gaps: Datadog PagerDuty notifications often lack enough context, forcing engineers to gather information themselves.
Static Workflows: Predefined routing rules can’t adapt to changing conditions.
Maintenance Overhead: Custom integrations need constant upkeep.
Priority and Severity Mapping: Datadog PagerDuty severity mapping can be challenging, as Datadog’s three-level system (ALERT, WARNING, INFO) doesn’t always align perfectly with PagerDuty’s urgency levels, potentially causing critical issues to receive inadequate attention or minor issues to trigger excessive escalation.
Alert Volume Management: High volumes of notifications can overwhelm on-call engineers, especially when Datadog PagerDuty priority settings aren’t properly calibrated for business impact.
Enter Hawkeye: Your Integration-Savvy GenAI Teammate for Datadog and PagerDuty
What if we flipped the script on incident response? Instead of engineers manually linking Datadog’s metrics with PagerDuty’s alerts, Hawkeye acts as a smart connector that seamlessly links these platforms while also using data from your entire observability toolkit. When a Datadog monitor detects an issue and PagerDuty creates an incident, Hawkeye automatically puts together the full picture.
This approach doesn’t replace your investment in monitoring tools, instead, it boosts the value of your Datadog-PagerDuty integration by providing the contextual intelligence needed to make faster, better decisions.
Beyond Simple Integration: Enhancing the PagerDuty Datadog Integration
When a Datadog monitor triggers a PagerDuty notification, Hawkeye jumps into action instantly, before the on-call engineer even sees the alert. It immediately connects Datadog metrics, examines recent changes, analyzes logs, and gathers APM trace data.
For example, if a latency spike triggers an alert, Hawkeye might find a recent code deployment that affected the same service, connect it with unusual database query patterns, and put these findings into a clear assessment.
This process takes seconds, compared to the 20+ minutes an engineer would typically spend logging into platforms, running queries, and linking metrics and incidents. Hawkeye continuously learns which Datadog metrics are good indicators for specific incidents, understanding the connections between monitoring data and operational events to provide increasingly accurate insights.
Transforming Datadog and PagerDuty Incident Management Workflow
Traditional workflows require engineers to wake up, log into systems, gather context, and come up with a response, all under pressure.
With Hawkeye, engineers start with a single view of the issue and all the information they need to fix it in one analysis. Routine issues are easily handled with recommended actions, and complex problems include detailed investigation summaries.
This changes the engineer from someone who gathers data to a strategic problem solver.
Traditional Datadog PagerDuty Workflow
Datadog detects an anomaly and triggers a monitor alert
PagerDuty creates an incident and notifies the on-call engineer
Engineer acknowledges the alert in PagerDuty
Engineer logs into Datadog to investigate the triggering metric
Engineer manually searches for related metrics, logs, and traces
Engineer determines the root cause and implements a fix
Engineer resolves the incident in PagerDuty
This process typically takes 30-60 minutes.
Hawkeye-Enhanced Workflow
Datadog detects an anomaly and triggers a monitor alert
Hawkeye analyzes Datadog metrics, logs, and traces.
Hawkeye connects the incident with historical data from PagerDuty.
Hawkeye prepares an analysis with recommendations.
PagerDuty creates an enriched incident with Hawkeye’s analysis attached
Engineer reviews Hawkeye’s analysis and implements the recommended solution
Engineer resolves the incident in PagerDuty
This reduces investigation time by 70-80%, allowing your engineers to focus on solutions.
Unlocking Actionable Insights with Effective AI Prompting
To get the most out of an AI SRE teammate like Hawkeye, it’s important to ask the right questions. For PagerDuty, prompts should help you understand incident response:
“Who is currently on-call for my critical services?”
“Are there any incidents at risk of breaching their SLA targets?”
“What services had the most PagerDuty escalations this month?”
For Datadog monitoring, good Gen AI prompts include:
“What are the most frequent errors in my application logs?”
“Which services have high error rates or response times?”
“Show me hosts with abnormal CPU or memory usage compared to baseline”
The Future of SRE Work: Evolving Beyond Reactive Datadog-PagerDuty Management
As monitoring becomes more complex and alert volumes increase, simply adding more engineers has its limits. SRE talent is scarce, expensive, and hard to keep.
Hawkeye changes this by intelligently automating routine Datadog PagerDuty workflows, creating a multiplier effect. Your team can manage more services without constantly needing more people, and it addresses burnout by enabling:
Higher-value work: Engineers shift from repetitive Datadog query writing and alert triaging to meaningful system improvements.
Improved on-call quality of life: Those middle-of-night PagerDuty alerts become less disruptive as Hawkeye provides immediate context and clear remediation steps.
Accelerated knowledge distribution: New team members gain immediate access to Hawkeye’s institutional knowledge about your environment’s Datadog metrics and PagerDuty incident patterns, dramatically shortening ramp-up time and reducing the “expertise bottleneck” common in SRE teams.
The impact on your business is significant: reduced recruitment costs, better employee retention, and the ability to scale operations more efficiently.
Getting Started
Implementing Hawkeye alongside your existing tools is a straightforward process that begins paying dividends immediately. While this blog focuses on Datadog and PagerDuty, Hawkeye’s integrations help you can connect it to your entire observability stack, creating a unified intelligence layer across all your tools.
Set up secure, read-only connections to Datadog and PagerDuty.
Start a project within Hawkeye, linking your key data sources.
Ready to transform your operations? Check our demo or contact us to see how Hawkeye can become your team’s AI-powered SRE teammate.
FAQ
What is Datadog?
Datadog is a cloud-based monitoring and analytics platform that provides real-time visibility into IT infrastructure and application performance. It excels at collecting, analyzing, and visualizing metrics, logs, and traces across distributed systems, helping organizations identify and troubleshoot issues before they impact users. Learn more.
What is PagerDuty?
PagerDuty is an incident management platform that helps organizations detect, triage, and resolve incidents quickly. It specializes in intelligent routing of alerts to the right responders, managing on-call schedules, and orchestrating incident response workflows. Learn more.
What is the difference between Datadog and PagerDuty? Should I use PagerDuty vs Datadog?
Datadog and PagerDuty serve complementary functions in your observability and incident response ecosystem. The integration of these tools creates a complete observability and incident management workflow. Datadog detects issues and generates alerts, while PagerDuty ensures those alerts reach the right people and facilitates the incident resolution process.
Datadog focuses on monitoring and observability:
Collecting metrics, logs, and traces
Visualizing performance data through dashboards
Detecting anomalies and generating alerts
PagerDuty specializes in incident response management:
How SRE teams are automating memory leak detection and prevention with Hawkeye
The PagerDuty alert breaks your concentration: “Average pod_memory_utilization_over_pod_limit GreaterThanOrEqualToThreshold 70.0” in the ‘frontend’ namespace. Your web application is gradually consuming more memory, and despite having comprehensive metrics and logs, pinpointing the root cause feels like trying to find a leak in a dark room where you can only see snapshots of where the water has been.
The Modern Memory Investigation Reality
In today’s Kubernetes environments, memory issues occur within the context of sophisticated observability stacks. CloudWatch captures container metrics, Prometheus tracks detailed memory stats, your APM solution monitors heap usage, and your logging platform records every OOMKilled event. Yet when memory leaks occur, this abundance of data often makes the investigation more complex rather than simpler.
A typical troubleshooting session involves juggling multiple tools and contexts:
You start in CloudWatch Container Insights, examining memory utilization trends. The metrics show a clear upward trend, but what’s driving it? Switching to Prometheus, you dive into more granular pod-level metrics, trying to correlate memory growth with specific activities or timeframes, you find increasing heap usage in several JVM instances, but is it normal application behavior or a genuine leak?
The investigation deepens as you cross-reference data:
Container metrics show memory usage approaching limits
Application logs reveal increased activity in certain components
Kubernetes events show periodic OOMKilled pod terminations
Request tracing shows certain API endpoints correlating with memory spikes
Each tool provides valuable data, but understanding how these pieces fit together requires constantly switching contexts and mentally correlating events across different timescales and granularities.
Why Memory Leaks Challenge Traditional Analysis
What makes memory leak investigation particularly demanding isn’t just identifying high memory usage – it’s understanding the pattern and root cause across your entire application stack. Memory issues often manifest in complex ways:
A memory leak in one microservice might only become apparent under specific traffic patterns. Garbage collection behavior can mask the true growth rate until it suddenly can’t keep up. Memory pressure on one node can cause pods to be evicted, triggering a cascade of rescheduling that spreads the impact across your cluster.
Your observability tools faithfully capture all these metrics and events, but understanding the sequence and cause-effect relationships requires simultaneously analyzing multiple data streams while understanding application behavior, container runtime characteristics, and Kubernetes resource management.
Hawkeye: Your Memory Analysis Expert
Here’s how Hawkeye transforms this investigation:
The Hawkeye Difference
What sets Hawkeye apart isn’t just its ability to monitor memory usage – it’s how it analyzes memory patterns across multiple observability systems simultaneously. While an SRE would need to manually correlate data between container metrics, JVM heap dumps, application logs, and Kubernetes events, Hawkeye processes all these data streams in parallel to quickly identify patterns and anomalies.
This parallel analysis capability allows Hawkeye to discover cause-and-effect relationships that might take hours or days for humans to uncover. By simultaneously examining application behavior, container metrics, and system events, Hawkeye can trace how a memory leak in one component ripples through your entire system.
Real World Impact
For teams using Hawkeye, the transformation goes beyond faster leak detection. Engineers report a fundamental shift in how they approach memory management:
Instead of spending hours correlating data across different monitoring tools during incidents, they can focus on implementing systematic improvements based on Hawkeye’s comprehensive analysis. The mean time to resolution for memory-related incidents has decreased dramatically, but more importantly, teams can prevent many memory leaks entirely by acting on Hawkeye’s early warnings and recommendations.
Implementation Journey
Integrating Hawkeye into your Kubernetes environment is straightforward:
Connect your existing observability tools – Hawkeye enhances rather than replaces your current monitoring stack
Configure your preferred incident response workflows
Review Hawkeye’s incident analysis, drill down with questions, and implement recommendations.
Scale your team and improve morale by transforming your approach to application debugging from reactive investigation to proactive improvement. Let Hawkeye handle the complexity of OOMKilled analysis while your team focuses on innovation.
Modern IT operations generate an overwhelming amount of telemetry data across dozens of tools and platforms. While traditional approaches struggle to process this complexity, Hawkeye takes a fundamentally different approach – using GenAI to transform how we analyze and respond to IT incidents. Let’s look under the hood to understand how Hawkeye works and why our security-first architecture sets us apart.
The Foundation: Security and Privacy Built in
Before diving into Hawkeye’s technical architecture, it’s crucial to understand our foundational security principles:
Zero data storage: Hawkeye operates as a completely ephemeral platform. We process your telemetry data in real-time and never store historical information. Once an analysis session ends, all data is automatically purged from memory.
Read-Only by default: Every connection to your infrastructure uses strictly read-only permissions. This isn’t just a policy – it’s architecturally enforced, making it technically impossible for Hawkeye to modify your systems or data.
Costumer-controlled access: You maintain complete control through customer-specific external IDs and custom trust policies. Access can be revoked instantly at any time.
The Architecture: Step by Step
Let’s walk through how Hawkeye processes an incident or investigation, following our architectural diagram below:
Diag. Hawkeye from Neubird architecture step by step
Step 1. Finding the Right Approach Using Runbooks
When an incident occurs Hawkeye first step is selecting the appropriate analysis strategy. Using your private ChromaDB vector database, Hawkeye identifies similar historical patterns and successful investigation approaches. It uses an embedding of your issue and ChromaDB’s fast similarity search – without ever storing any of your telemetry data.
As it learns more about your investigations this vector database can build up knowledge about investigation plans that work best for your systems.
2. Creating the Investigation Plan Using LLMs Reasoning Capabilities
At this step, the LLM’s reasoning capabilities are leveraged to formulate a dynamic investigation plan, one that may be inspired by the retrieved information from step one but leverages the generative power of the LLM to adapt it. Hawkeye constructs a detailed chain of thought for the investigation, adapting its approach based on:
The type of incident or investigation
Available telemetry sources described through metadata
Description of your architecture based on available information
Historical patterns of similar issues
No configuration or telemetry data is included in the prompts to the LLMs. The choice of LLM changes based on the up to date benchmarks to achieve the best results.
Step 3. Telemetry Program Generation
Here’s where Hawkeye’s innovation shines. Instead of sending your sensitive telemetry data to an LLM, Hawkeye:
Creates a specialized telemetry retrieval program
Uses our fine-tuned LLM only for program logic, never for data processing
Ensures all actual data handling happens in isolated memory space
The fine-tuning of the LLM (currently based on Llama 3.2 70B) is done by Neubird using only synthetic data programs and leveraging LARK files to control and validate the syntax of the generated telemetry program is valid and will produce results.
Step 4. Secure Data Processing
Hawkeye executes the telemetry program in a secure, ephemeral runtime environment:
Correlates data across multiple sources
Performs necessary calculations and mathematical analysis in python
Maintains strict memory isolation for each customer’s telemetry data
Automatically purges all data after processing an investigation
Step 5. Real-Time Data Access Layer
Hawkeye’s second secret weapon is its secure data access layer. Queries to access data are all written in a common syntax which the fine-tuned LLM can generate with 100% accuracy, resulting in reliable and precise data access no matter what the data source is. Our secure data access layer:
Uses temporary credentials with minimal scope
Implements read-only access across all integrations
Supports major cloud providers (AWS, Azure, GCP) and observability tools
Never stores your telemetry data on disk
Leverages schema on read technology, avoiding issues with schema drift
Step 6. Continuous Refinement
As the investigation progresses, Hawkeye:
Iteratively refines its analysis approach based assertion on the data performed by the secure data processor, allowing to adapt to new information without sending telemetry data to the LLM
Maintains audit trails of its reasoning and investigation steps
Never uses your data to train or improve its models
Step 7. Final Analysis and Actions
Once all facts are available and the investigation has converged Hawkeye will produce:
Detailed root cause analysis
Clear evidence for all findings
Specific recommended actions
In order to protect your telemetry and configuration data, Hawkeye leverages a privately hosted open source LLM to produce this final analysis.
Hawkeye represents a fundamental shift in IT operations – combining the power of GenAI with unwavering commitment to security and privacy. By processing complex telemetry data in real-time while maintaining zero data persistence, we’re transforming how teams handle incidents and investigations.
Ready to see Hawkeye in action? Contact us to schedule a demo and learn how we can help transform your IT operations while maintaining the highest security standards.
How SRE teams are eliminating scaling headaches with Hawkeye
It’s peak holiday shopping season, and your e-commerce platform is experiencing record traffic. Your team initiates a scaling operation to handle the load, increasing the UI deployment’s replica count. But instead of scaling smoothly, pods remain stuck in pending state. The PagerDuty alert sounds: “Maximum pod_status_pending GreaterThanThreshold 0.0”. What should be a routine scaling operation has become a critical incident requiring deep investigation across multiple layers of your Kubernetes infrastructure.
The Modern Scaling Investigation Reality
In today’s Kubernetes environments, scaling issues occur within sophisticated observability stacks. CloudWatch captures detailed node and pod metrics while recording scheduler decisions. Prometheus tracks resource utilization, and your APM solution monitors service performance. Yet when scaling problems arise, this wealth of information often complicates rather than simplifies the investigation.
A typical troubleshooting session spans multiple systems and contexts:
You start in Prometheus, examining node capacity metrics. Resources seem available at the cluster level, but are they accessible to your workload? Switching to CloudWatch Container Insights, you dive into pod-level metrics, trying to understand resource utilization patterns. Your logging platform shows scheduler events, but the messages about resource pressure don’t align with your metrics.
The investigation expands as you correlate data across systems:
Node metrics show available capacity
Pod events indicate resource constraints
Scheduler logs mention taint conflicts
Prometheus alerts show resource quotas approaching limits
Service mesh metrics indicate traffic distribution issues
Each tool provides critical information, but understanding how these pieces fit together requires constantly switching contexts and mentally correlating events across different abstraction layers in your Kubernetes stack.
Why Scaling Challenges Defy Quick Analysis
What makes scaling investigation particularly demanding isn’t just checking resource availability – it’s understanding the complex interaction between different layers of Kubernetes resource management and constraints:
Available CPU and memory might look sufficient at the cluster level, but pod anti-affinity rules could prevent optimal placement. Node selectors and taints might restrict where pods can run. Resource quotas at the namespace level might block scaling even when node capacity is available. Quality of Service classes affect pod scheduling priority, and Pod Disruption Budgets influence how workloads can be redistributed.
Your observability tools faithfully record all these metrics and events, but understanding the sequence and cause-effect relationships requires simultaneously analyzing multiple data streams while understanding Kubernetes scheduling logic, resource management, and workload distribution patterns.
Hawkeye: Your Scaling Expert
Here’s how Hawkeye transforms this investigation:
The Hawkeye Difference
What sets Hawkeye apart isn’t just its ability to check resource metrics – it’s how it analyzes capacity constraints across multiple layers of your Kubernetes infrastructure simultaneously. While an SRE would need to manually correlate data between node metrics, scheduler logs, pod events, and cluster configurations, Hawkeye processes all these data streams in parallel to quickly identify bottlenecks and constraints.
This parallel analysis capability allows Hawkeye to discover cause-and-effect relationships that might take hours for humans to uncover. By simultaneously examining node capacity, scheduling rules, workload distribution patterns, and historical scaling behavior, Hawkeye can identify subtle constraints that wouldn’t be apparent from any single metric or log stream.
Real World Impact
For teams using Hawkeye, the transformation goes beyond faster scaling incident resolution. Engineers report a fundamental shift in how they approach capacity management:
Instead of spending hours correlating data across different monitoring tools during scaling incidents, they can focus on implementing systematic improvements based on Hawkeye’s comprehensive analysis. The mean time to resolution for scaling-related incidents has decreased dramatically, but more importantly, teams can prevent many scaling bottlenecks entirely by acting on Hawkeye’s early warnings and recommendations.
Implementation Journey
Integrating Hawkeye into your Kubernetes environment is straightforward:
Connect your existing observability tools – Hawkeye enhances rather than replaces your current monitoring stack
Configure your preferred incident response workflows
Review Hawkeye’s incident analysis, drill down with questions, and implement recommendations.
Scale your team and improve morale by transforming your approach to application debugging from reactive investigation to proactive improvement. Let Hawkeye handle the complexity of pod_status_pending analysis while your team focuses on innovation.
How Desktop Infrastructure Teams are Conquering the Morning Login Storm
It’s 8:45 AM, and your phone lights up with a flood of tickets. “VDI is crawling,” reads the first message. “Can’t access my desktop,” says another. Within minutes, your ServiceNow queue is filled with frustrated users reporting login times stretching past three minutes. You’re facing the dreaded “morning login storm,” and somewhere in the maze of profiles, network traffic, and host metrics lies the root cause – if only you could find it fast enough.
For desktop infrastructure teams, this scenario is all too familiar. In a recent case study, a Fortune 500 company reported that their average login times had ballooned from 45 seconds to over 180 seconds, affecting 65% of their workforce. The business impact? Thousands of lost productivity hours and mounting frustration from both users and IT staff.
The Complex Reality of Modern VDI Environments
Today’s VDI deployments are far more complex than their predecessors. Consider the interconnected components that must work in perfect harmony for a single login:
Traditional monitoring approaches often fall short because they focus on individual metrics rather than the holistic user experience. Your dashboard might show green status lights while users face unacceptable delays. More concerning, by the time you’ve collected and correlated data from multiple tools, precious troubleshooting time has been lost.
The Hidden Costs of Slow Logins
The impact of VDI performance issues extends far beyond the obvious frustration of waiting for a desktop to load. Organizations face:
Lost productivity during peak business hours
Increased support ticket volume overwhelming IT teams
Shadow IT as users seek alternatives
Employee satisfaction and retention challenges
Reduced confidence in IT infrastructure
One desktop administrator we spoke with put it perfectly: “Every minute of login delay is multiplied by hundreds of users. It’s not just time we’re losing – it’s trust.”
Enter Hawkeye: Your AI-Powered VDI Performance Partner
This is where a fundamentally different approach comes into play. Instead of relying on static thresholds and manual correlation, Hawkeye acts as an intelligent teammate that understands the complex interplay of VDI components.
In a recent deployment, Hawkeye identified a perfect storm of conditions causing login delays:
Profile load times exceeding 90 seconds for 75% of sessions
40% packet retransmission rates during peak periods
Profile server CPU utilization spiking to 92%
Storage latency averaging 45ms for read operations
Cache hit ratios dropping to 35% during login storms
More importantly, Hawkeye didn’t just collect these metrics – it understood their relationships and impact on the user experience. Within minutes, it provided a comprehensive analysis and actionable remediation steps.
Organizations leveraging Hawkeye for VDI performance management are seeing transformative results:
Login times reduced by up to 75%
Support ticket volume decreased by 60%
Mean time to resolution cut from hours to minutes
Proactive resolution of 40% of potential issues before user impact
Looking Forward: From Reactive to Proactive
The future of VDI management isn’t about adding more monitoring tools or building more complex dashboards. It’s about having an intelligent teammate that understands the intricacies of your environment and can take action before users are impacted.
Hawkeye is leading this transformation by:
Learning normal login patterns for your environment
Predicting potential bottlenecks before they impact users
Automatically correlating events across your VDI stack
Providing clear, actionable recommendations for optimization
Ready to Transform Your VDI Operations?
If you’re ready to move beyond the limitations of traditional monitoring and embrace the future of intelligent VDI management, we’re here to help. Contact us to learn how Hawkeye can become your team’s AI-powered desktop infrastructure expert and help deliver the consistent, high-performance VDI experience your users deserve.
How SRE teams are revolutionizing virtualization operations with GenAI
It’s 2 AM, and your phone lights up with another alert: “Critical: Database VM Performance Degradation.” As you dive into your KubeVirt dashboard, you’re faced with a wall of metrics – CPU throttling, IO wait times, memory pressure, and storage latency all competing for your attention. Which metric matters most? What’s the root cause? And most importantly, how quickly can you restore service before it impacts your business?
For SRE teams managing virtualized workloads on Kubernetes, this scenario is all too familiar. KubeVirt has revolutionized how we run virtual machines on Kubernetes, but it’s also introduced new layers of complexity in performance monitoring and troubleshooting. When a VM starts degrading, engineers must correlate data across multiple layers: the VM itself, the KubeVirt control plane, the underlying Kubernetes infrastructure, and the physical hardware – all while under pressure to resolve the issue quickly.
The Reality of KubeVirt Performance Investigation
Traditional approaches to VM performance troubleshooting often fall short in Kubernetes environments. Consider a recent incident at a major financial services company: Their production database VM suddenly showed signs of performance degradation. The traditional investigation process looked something like this:
Check VM metrics in KubeVirt dashboard
Review node resource utilization
Analyze storage metrics
Investigate guest OS metrics
Check impact on dependent services
Correlate timestamps across different metric sources
Draw conclusions from fragmented data
This manual process typically takes hours, requires multiple context switches between tools, and often misses crucial correlations that could lead to faster resolution. Meanwhile, dependent services degrade, and business impact compounds by the minute.
The Hidden Costs of Manual Investigation
The true cost of traditional VM performance troubleshooting extends far beyond just the immediate incident:
Engineering Time: Senior engineers spend hours manually correlating data across different layers of the stack
Business Impact: Extended resolution times mean longer service degradation
Team Burnout: Complex investigations at odd hours contribute to SRE team fatigue
Missed Patterns: Without systematic analysis, recurring patterns often go unnoticed
Knowledge Gap: Detailed investigation steps often remain undocumented, making knowledge transfer difficult
Enter Hawkeye: Your AI-Powered VM Performance Expert
Hawkeye transforms this investigation process through its unique ability to simultaneously analyze and correlate data across your entire stack. Let’s look at how Hawkeye handled the same database VM performance incident:
Within minutes of the initial alert, Hawkeye had:
Identified CPU throttling at 98% of allocated limits
Correlated high IO wait times (45ms) with storage IOPS throttling
Quantified the impact on dependent services (35% increased latency)
Generated a comprehensive analysis with actionable recommendations
But Hawkeye’s value goes beyond just speed. Its ability to understand the complex relationships between different layers of your infrastructure means it can identify root causes that might be missed in manual investigation. In this case, Hawkeye correlated the VM’s performance degradation with recent storage class QoS limits and memory balloon device behavior – connections that might take hours to discover manually.
With Hawkeye as part of your team, the investigation workflow changes dramatically:
Instant Context: Instead of jumping between dashboards, engineers start with a complete picture of the incident
Automated Correlation: Hawkeye automatically connects metrics across VM, host, storage, and service mesh layers
Clear Action Items: Each analysis includes specific, prioritized recommendations for resolution
Continuous Learning: Hawkeye builds a knowledge base of your environment, improving its analysis over time
Moving from Reactive to Proactive
The real power of Hawkeye lies in its ability to help teams shift from reactive troubleshooting to proactive optimization. By continuously analyzing your environment, Hawkeye can:
Identify potential resource constraints before they cause incidents
Recommend optimal VM resource allocations based on actual usage patterns
Alert on subtle performance degradation patterns before they become critical
Provide trend analysis to support capacity planning decisions
Transforming your KubeVirt operations with Hawkeye is straightforward:
Connect your telemetry sources:
KubeVirt metrics
Kubernetes cluster metrics
Storage performance data
Service mesh telemetry
Configure your preferred incident management integration
Start receiving AI-powered insights immediately
The Future of VM Operations
As virtualization continues to evolve with technologies like KubeVirt, the old ways of monitoring and troubleshooting no longer suffice. Hawkeye represents a fundamental shift from manual correlation to AI-driven analysis, transforming how SRE teams manage virtual infrastructure and enabling them to focus on strategic improvements rather than reactive firefighting.
Ready to transform your KubeVirt operations? Contact us to see how Hawkeye can become your team’s AI-powered SRE teammate and help your organization tackle the complexity of modern virtualization environments.
How SRE teams are revolutionizing application debugging with Hawkeye
The PagerDuty alert comes in at the worst possible time: “Maximum pod_container_status_waiting_reason_crash_loop_back_off GreaterThanThreshold 0.0”. Your application is caught in the dreaded CrashLoopBackOff state. While your CloudWatch logs capture every crash and restart, the sheer volume of error data makes finding the root cause feel like solving a puzzle in the dark.
The Traditional Debug Dance
In a modern Kubernetes environment, SREs have powerful tools at their disposal. CloudWatch diligently captures every log line, metrics flow into Prometheus, and your APM solution tracks every transaction. Yet, when faced with a CrashLoopBackOff, these tools often present more questions than answers.
A typical investigation starts with CloudWatch Logs, where you’re immediately confronted with thousands of entries across multiple restart cycles. You begin the methodical process of piecing together the story: the first crash occurrence, any changes in error messages between restarts, and potential patterns in the pod’s behavior before each failure.
Next comes the metrics investigation in Prometheus. You pull up graphs of memory usage, CPU utilization, and network activity, looking for correlations with the crash timing. Everything looks normal, which is both reassuring and frustrating – no obvious resource constraints to blame.
Then it’s time to dig deeper. You pull up the Kubernetes events, checking for any cluster-level issues that might be affecting the pod. You review recent deployments in your CI/CD pipeline, wondering if a configuration change slipped through code review. Each step adds more data but doesn’t necessarily bring you closer to a resolution.
Why CrashLoopBackOff Defies Traditional Analysis
What makes CrashLoopBackOff particularly challenging isn’t a lack of data – it’s the complexity of piecing together the right narrative from overwhelming amounts of information. Modern observability tools give us unprecedented visibility into our systems, but they don’t inherently understand the relationships between different signals.
A single CrashLoopBackOff incident typically spans multiple dimensions:
The application layer might show clean logs right up until the crash, missing the crucial moments that would explain the failure. System metrics might appear normal because the pod isn’t running long enough to establish baseline behavior. Kubernetes events capture the restarts but not the underlying cause.
Even more challenging is the ripple effect through your microservices architecture. A crashing service can trigger retry storms from dependent services, creating noise that obscures the original problem. Your observability tools faithfully record every detail, but understanding the cascade of events requires deep system knowledge and careful analysis.
Hawkeye: Bringing Context to Chaos
Here’s how Hawkeye transforms this investigation:
The Hawkeye Difference
What sets Hawkeye apart isn’t just its ability to process logs faster than humans – it’s how it understands the complex relationships between different parts of your system. When Hawkeye analyzes a CrashLoopBackOff, it doesn’t just look at the logs in isolation. It builds a comprehensive narrative by:
Simultaneously analyzing data across multiple observability systems and environments. While humans must context-switch between different tools and mentally piece together timelines, Hawkeye can instantly correlate events across your entire observability stack. What might take an SRE hours of checking CloudWatch logs, then Prometheus metrics, then deployment histories, and then trying to build a coherent timeline, Hawkeye can process in seconds by analyzing all these data sources in parallel.
Analyzing the impact on your entire service mesh. Instead of just focusing on the crashing pod, Hawkeye maps out how the failure ripples through your system, helping identify whether the crash is a cause or symptom of a broader issue.
Correlating deployment changes with system behavior. Hawkeye doesn’t just know what changed – it understands how those changes interact with your existing infrastructure and configuration.
For teams that have integrated Hawkeye into their operations, the transformation goes beyond faster resolution times. Engineers report a fundamental shift in how they approach application reliability:
Instead of spending hours reconstructing what happened during an incident, they can focus on implementing Hawkeye’s targeted recommendations for system improvement. The mean time to resolution for CrashLoopBackOff incidents has dropped from hours to minutes, but more importantly, repeat incidents have become increasingly rare as Hawkeye helps teams address root causes rather than symptoms.
Implementation Journey
Integrating Hawkeye into your Kubernetes environment is straightforward:
Connect your existing observability tools – Hawkeye enhances rather than replaces your current monitoring stack
Configure your preferred incident response workflows
Review Hawkeye’s incident analysis, drill down with questions, and implement recommendations.
Scale your team and improve morale by transforming your approach to application debugging from reactive investigation to proactive improvement. Let Hawkeye handle the complexity of crash analysis while your team focuses on innovation.
It’s 8:45 AM. You’re just getting started with your first coffee, and your inbox is already blowing up with Commvault alerts from overnight backups. Three failed jobs need looking into, two clients are dragging performance-wise, and someone from dev desperately needs a restore from last week. Yep, just another morning managing enterprise backups.
Sound familiar? You’re not the only one. Keeping Commvault backups running smoothly is critical, but it’s getting tougher as organizations juggle more data across different systems. Making sure backups are reliable and efficient is a bigger headache than ever.
The Hidden Costs of Traditional Commvault Backup Management
The way most teams handle Commvault backups often follows a familiar, yet inefficient, routine. You spend hours every day:
Manually sifting through job failure notifications.
Backup troubleshooting and investigating performance issues with only partial context.
Trying to connect problems across different clients and storage.
Keeping an eye on storage capacity across various targets.
Dealing with urgent restore requests.
Running and analyzing compliance reports.
Commvault’s Command Center is powerful, no doubt. But the truth is, most teams still lean heavily on manual digging and “that one person who knows things” to keep backups running. This isn’t just time-consuming; it’s becoming impossible as data grows and the time you have to recover shrinks.
Current Integration Methods to Address Commvault Pain Points
Teams have tried different ways to ease the Commvault burden, but each has its drawbacks.
Commvault ServiceNow Integration for Incident Tracking
You hook Commvault up to ServiceNow to automatically create tickets for failed backups or jobs “Completed With Errors” (CWE). The idea is to pull alerts from Command Center into tickets. Problem is, getting the API scripting right to map alerts to incidents is tricky. One syntax error or mismatched field, and critical alerts get lost, forcing you to dig through logs like CVD.log manually.
This helps you prioritize, sure, but it doesn’t connect the dots between jobs to find root causes, like recurring failures due to bad storage allocation. It’s reactive and still needs a lot of manual effort.
Commvault Azure Backup through Azure Blob Storage for Data Recovery Debugging
Syncing Commvault backups to Azure Blob Storage gives you an offsite copy, helpful when restores fail because of corrupted or missing data chunks. You end up checking Azure logs for transfer errors – often finding bandwidth limits or the wrong storage tier (like Archive instead of Hot) are delaying access and putting SLAs at risk.
Azure keeps the data safe, but it doesn’t tell you why the jobs failed in the first place. You’re still left manually hunting down issues without seeing patterns across multiple failures.
Commvault Workflow Automation for Error Handling
Commvault workflow automation enables error responses, like retrying a job after a “chunk not accessible” error, using a GUI instead of heavy coding. While this cuts down on manual clicks, logic errors in the workflow itself can cause silent failures, meaning you’re back to checking logs like Workflow.log.
Complex jobs, like VSA backups, often break mid-workflow anyway, leaving you to trace the issue manually. It reduces clicks but not the root-cause investigation – it’s more of a band-aid than a real fix.
Commvault Splunk Integration for Log Correlation
You can feed Commvault logs to Splunk (like CVD.log, SQLiDA.log) to search for error patterns, such as “Error Code 13:138” (missing chunks), helping correlate issues across jobs after the fact. But indexing huge log volumes drives up Splunk costs, and writing effective queries takes specialized skills.
It’s useful for deep dives later, but too slow for fixing things now. It lacks the immediate pattern spotting needed for responsive backup management.
REST APIs for Error Automation
Commvault’s REST APIs give you pinpoint control for automating error handling, like retrying jobs or checking logs for common errors (think “Error Code 19:1131” for client connection issues). While APIs offer granular control, scripting these routines gets complicated fast. APIs can fix specific problems, but they won’t spot broader patterns or proactively flag underlying network or policy issues.
PowerShell for Log Analysis
Lots of folks use PowerShell scripts to automate routine Commvault tasks – querying logs, checking server statuses, or handling SQL transfer problems (“Error Code 30:323”). But these scripts can get complex quickly. Unlike smart AI analysis, PowerShell scripts only react to errors they already know about; they don’t offer predictive insights.
Commvault Jira Integration for Collaborative Error Tracking
Hooking Jira up with Commvault helps teams work together to track and fix issues like slow restores or snapshot errors. But setting up Jira webhooks can be a real pain – problems with API tokens, messed-up regex patterns, or webhook rules often mean alerts get dropped or sent to the wrong place.
While Jira helps teams collaborate, critical issues can easily get buried in long lists of tickets waiting for someone to look at them.
Rethinking Commvault Backup Management for the AI Era
What if your morning routine looked different? Imagine walking in to find:
Common backup failures already diagnosed with action plans defined
Performance issues proactively analyzed with solutions identified
Capacity problems predicted with prevention measures ready
Restore requests automatically triaged and prioritized
This isn’t a distant future—it’s the reality for teams that have embraced AI-powered operations using Hawkeye. By combining Commvault’s robust backup capabilities with an intelligent, vigilant, and tireless AI operations teammate, organizations are transforming how they protect their data.
The Power of GenAI SRE for Commvault Backup Operations
Modern backup management needs more than automation; it needs smarts. Here’s how Hawkeye, a GenAI-powered SRE, changes the game for Commvault setups:
Proactive Issue Resolution
Automated diagnostics: Finds and figures out common Commvault backup failures before they mess things up, giving your team clear steps and saving hours of guesswork.
Spots the real reasons behind recurring issues by analyzing patterns across many backup jobs, clients, and storage targets.
Warns you about potential storage capacity shortages, performance slowdowns, and backup window problems before they happen.
Intelligent Investigation
Connects error data from Commvault logs with info from other systems like ServiceNow, Azure, and Splunk automatically – no manual digging required.
Gives you detailed root cause analysis for complex problems with specific fix suggestions, not just listing symptoms.
Learns from every investigation to get better at handling future issues, building an understanding of your specific Commvault environment and its quirks.
Enhanced Backup Workflow Integration
Automated workflow recommendations: Suggests better Commvault workflows based on your setup and past performance.
Integration optimization: Makes sure your Commvault connections with ServiceNow, Azure, etc., are working right without you having to watch them constantly.
Workflow failure prediction: Spots potential weak points in your automated workflows before they break in production.
A Day in the Life with a GenAI-Powered SRE
Let’s replay that morning scenario, but this time Hawkeye is on your team:
8:45 AM: You arrive. Overnight backup issues? Already sorted and prioritized. Those three failed jobs:
Two were automatically investigated. Hawkeye found a pattern of flaky network connections hitting certain clients and gave detailed steps to fix it.
One failure was unique. Hawkeye couldn’t fully diagnose it but gathered all the relevant logs and metrics so you can troubleshoot Commvault job errors.
Those performance slowdowns? Proactively analyzed. Hawkeye noticed backup times creeping up and linked it to recent storage policy changes. It’s given specific advice to optimize storage based on past patterns.
That restore request? Already validated. Hawkeye confirmed the data is available, estimated how long it’ll take, and suggested the best restore method for the specific data needed.
Instead of drowning in routine investigations, you can actually focus on making your backup infrastructure better, while your AI teammate handles the daily grind.
Transforming Commvault Workflows with AI
Traditional Commvault workflows take a lot of manual setup and babysitting, and they don’t adapt well. Here’s how Hawkeye changes that:
Traditional Commvault Workflow
Backup job fails with “Error Code 19:1131” (client connectivity).
You get an email alert or spot the failure in Command Center.
You manually investigate – check client status, network, logs.
You create a ticket in ServiceNow, assign it.
Tech team fixes it, reruns the backup.
You check it worked, close the ticket.
This process easily takes 30-60 minutes per failure, and nobody learns much for next time.
Hawkeye-Enhanced Workflow
Backup job fails with “Error Code 19:1131”.
Hawkeye instantly analyzes the error against past data.
Hawkeye connects the failure to recent network changes or patterns.
Hawkeye creates an enriched ServiceNow ticket with a full analysis.
Hawkeye suggests specific fix steps based on what worked before.
You implement the suggested fix.
Hawkeye checks the fix worked and updates its knowledge for the future.
This slashes investigation time by 70-80%. Your team focuses on fixing, not just finding.
The Future of Commvault Backup Management
Data keeps exploding. The old way of managing backups just won’t cut it anymore. Bringing AI onto your team for Commvault operations isn’t just about solving today’s problems—it’s about getting ready for tomorrow.
The future is about blending human smarts with AI muscle. While your AI teammate handles the routine stuff, you can focus on bigger picture initiatives that matter:
Design better backup setups using AI insights.
Create smarter backup and retention rules based on actual usage.
Boost recovery readiness with proactive testing.
Find ways to cut storage costs without risking data.
Getting Started
Adding Hawkeye to your Commvault environment is straightforward. Hawkeye’s integration capabilities mean you can connect it to your entire observability stack, creating a unified intelligence layer across all your tools.
Set up secure, read-only connections to your Commvault environment.
Ready to transform your Commvault backup operations? Check our demo or contact us to learn how Hawkeye can become your team’s AI-powered backup analyst and help you handle modern data protection complexity.
FAQ
What is Commvault?
Commvault is data protection and management software that helps companies backup, restore, archive, replicate, and search their data across different environments (on-prem, virtual, cloud). It gives you one place to manage data protection. Learn more.
What are Commvault workflows?
Commvault workflows are automated sequences of tasks you can set up to run based on events or schedules. They let admins automate common stuff like retrying failed backup jobs, handling errors, or sending notifications without needing complex scripts. You build them using Commvault’s graphical tool, and they can even link to systems like ServiceNow. While useful, these traditional workflows don’t have the smarts to adapt like AI solutions such as Hawkeye can.
How does Commvault integrate with ServiceNow?
Commvault connects with ServiceNow to automate incident management for backups. This lets ServiceNow users see backup job SLAs, schedules, and details. When backups fail or have errors, Commvault can automatically create ServiceNow tickets with the details. This helps streamline things but needs careful setup and doesn’t offer the smart correlation that AI provides.
What are common Commvault backup failures?
Frequent Commvault issues include client connection problems (Error Code 19:1131), trouble accessing storage targets (Error Code 13:138), backup jobs timing out (Error Code 30:323), backups finishing with errors (CWE status), Commvault slow restore performance from bad settings, media management headaches, and license failures. Many of these problems need to troubleshoot Commvault job errors, manual digging through logs and different interfaces – exactly the kind of thing AI assistance is great for.