How SRE teams are transforming CPU utilization management with AI
A PagerDuty alert breaks the silence: “GreaterThanUpperThreshold” on node CPU utilization. Your Kubernetes cluster is experiencing severe CPU spikes, and although your observability stack is capturing every metric, the root cause remains elusive. With applications spread across dozens of namespaces and hundreds of pods, finding the culprit means correlating data across multiple monitoring systems and timeframes.
The Resource Investigation Reality
In a modern Kubernetes environment, CPU spike investigation isn’t hampered by a lack of data – quite the opposite. Your observability stack provides multiple lenses into the problem:
CloudWatch Container Insights shows node-level CPU metrics spiking to concerning levels. Prometheus captures detailed pod-level resource utilization across your cluster. Your APM solution tracks application performance metrics. Your logging platform collects application logs that might indicate why certain components are consuming more resources than usual.
Yet this wealth of data often makes the investigation more complex rather than simpler. A typical troubleshooting session involves constantly switching between these different tools and mentally correlating their data:
You start in CloudWatch, identifying the affected nodes and the timing of the spikes. Switching to Prometheus, you examine pod-level metrics, trying to match spike patterns with specific workloads. Your APM tool shows increased latency in several services, but is it cause or effect? The logging platform shows increased error rates in some components, but do they align with the CPU spikes?
Each tool tells part of the story, but piecing together the complete narrative requires extensive context switching and complex mental correlation of events across different timelines and granularities.
Why CPU Spikes Challenge Traditional Analysis
What makes CPU spike investigation particularly demanding isn’t just finding the high-CPU workload – it’s understanding the broader context and impact across your entire system. A spike in one component can trigger a cascade of effects:
Increased CPU usage in one pod might cause the Kubernetes scheduler to rebalance workloads across nodes. This rebalancing can trigger further spikes as pods migrate and initialize. Meanwhile, resource contention might cause other services to slow down, leading to retry storms that amplify the problem.
Your observability tools capture all of this activity faithfully, but understanding the sequence of events and cause-effect relationships requires simultaneously analyzing multiple data streams and understanding complex system interactions.
Hawkeye: Bringing Clarity to Resource Analysis
Here’s how Hawkeye transforms this investigation:
The Hawkeye Difference
What sets Hawkeye apart isn’t just its ability to collect metrics faster than humans – it’s how it analyzes data streams in parallel to build a comprehensive understanding of system behavior. While an SRE would need to manually switch between CloudWatch, Prometheus, logging tools, and application metrics to piece together the story, Hawkeye simultaneously processes all these data sources to identify patterns and correlations.
This parallel processing capability allows Hawkeye to quickly identify cause-and-effect relationships that might take hours for humans to discover. By analyzing metrics, logs, events, and application data simultaneously, Hawkeye can trace how a CPU spike in one component ripples through your entire system.
Real World Impact
For teams using Hawkeye, the transformation goes beyond faster incident resolution. Engineers report a fundamental shift in how they approach resource management:
Instead of spending hours correlating data across different observability tools, they can focus on implementing systematic improvements based on Hawkeye’s comprehensive analysis. The mean time to resolution for CPU-related incidents has dramatically decreased, but more importantly, teams can now prevent many issues before they impact production by acting on Hawkeye’s early warnings and recommendations.
Integrating Hawkeye into your Kubernetes environment is straightforward:
Connect your existing observability tools – Hawkeye enhances rather than replaces your current monitoring stack
Configure your preferred incident response workflows
Review Hawkeye’s incident analysis, drill down with questions, and implement recommendations.
Scale your team and improve morale by transforming your approach to application debugging from reactive investigation to proactive improvement. Let Hawkeye handle the complexity of CPU Spike analysis while your team focuses on innovation.
How SRE teams are transforming error analysis with Hawkeye
Your monitoring dashboard explodes with alerts as your web application in the ‘checkout’ namespace starts generating a torrent of errors. CloudWatch is capturing every error, your APM solution is tracking every failed request, and Prometheus metrics show increasing error rates – but with different error types, status codes, and messages flooding in, finding the signal in this noise feels like trying to drink from a fire hose.
The Modern Error Analysis Challenge
In today’s microservices environments, error investigation occurs within sophisticated observability stacks. Your APM solution traces every request, CloudWatch captures detailed error logs, Prometheus tracks error metrics, and your logging platform aggregates errors across services. Yet when error floods occur, this wealth of information often obscures rather than illuminates the root cause.
A typical investigation unfolds across multiple systems:
You start in your APM tool, watching transaction traces light up with errors. The service dependency map shows cascading failures, but which service triggered the cascade? Switching to CloudWatch, you wade through error logs trying to identify patterns. Each log entry adds more context but also more complexity – different error types, varying stack traces, and multiple affected components.
The investigation branches out as you attempt to correlate data:
APM traces show increased latency preceding the errors
Prometheus metrics indicate growing error rates across multiple services
Kubernetes events reveal pods restarting due to failed health checks
Load balancer metrics show increased 5xx responses
Individual service logs contain different error messages and stack traces
Each tool captures a piece of the puzzle, but understanding how these pieces fit together requires constantly switching contexts and mentally correlating events across different services, timelines, and abstraction layers.
Why Error Floods Challenge Traditional Analysis
What makes error flood analysis particularly demanding isn’t just the volume of errors – it’s understanding the relationships and root causes across a distributed system. Error patterns often manifest in complex ways:
An error in one microservice might trigger retry storms from dependent services, amplifying the error rate. Rate limiting kicks in, causing a new wave of errors with different signatures. Circuit breakers trip, changing the error patterns yet again. Each layer of your reliability mechanisms, while protecting the system, also transforms the error signatures and complicates the analysis.
Your observability tools dutifully record every error, metric, and trace, but understanding the sequence of events and cause-effect relationships requires simultaneously analyzing multiple data streams while understanding service dependencies, reliability patterns, and failure modes.
Hawkeye: Your Error Analysis Expert
Here’s how Hawkeye transforms this investigation:
The Hawkeye Difference
What sets Hawkeye apart isn’t just its ability to aggregate errors – it’s how it analyzes error patterns across multiple observability systems simultaneously. While an SRE would need to manually correlate data between APM traces, error logs, metrics, and service dependencies, Hawkeye processes all these data streams in parallel to quickly identify patterns and causality chains.
This parallel analysis capability allows Hawkeye to discover cause-and-effect relationships that might take hours for humans to uncover. By simultaneously examining service behavior, error patterns, and system metrics, Hawkeye can trace how an error in one component cascades through your entire system.
For teams using Hawkeye, the transformation goes beyond faster error resolution. Engineers report a fundamental shift in how they approach system reliability:
Instead of spending hours correlating data across different monitoring tools during incidents, they can focus on implementing systematic improvements based on Hawkeye’s comprehensive analysis. The mean time to resolution for error floods has decreased dramatically, but more importantly, teams can prevent many cascading failures entirely by acting on Hawkeye’s early warnings and recommendations.
Implementation Journey
Integrating Hawkeye into your Kubernetes environment is straightforward:
Connect your existing observability tools – Hawkeye enhances rather than replaces your current monitoring stack
Configure your preferred incident response workflows
Review Hawkeye’s incident analysis, drill down with questions, and implement recommendations.
Scale your team and improve morale by transforming your approach to application debugging from reactive investigation to proactive improvement. Let Hawkeye handle the complexity of taming the error flood while your team focuses on innovation.
How SRE teams are evolving their Kubernetes observability with AI
Your team has spent tons of hours building that perfect Grafana dashboard for Kubernetes monitoring. You’ve got detailed panels for CPU, memory, network metrics, and alerts set up through Prometheus. But when a critical service starts acting up, your engineers still spend way too much time digging through dashboards, trying to connect metrics, and scanning logs to figure out what’s actually going on.
Sound familiar? You’re not the only one. While Grafana gives you great visuals for Kubernetes monitoring and Prometheus is solid for collecting metrics, the sheer complexity of Kubernetes has created a big problem: People just can’t process and connect all that data fast enough for modern cloud-native operations.
The Hidden Costs of Relying Only on Dashboards
Today’s Kubernetes setups generate a massive amount of data. A typical production cluster might track:
Thousands of metrics across hundreds of pods
Multiple node pools with varying resource configurations
Complex autoscaling behaviors
Intricate service dependencies
Network policies and security configurations
Traditional approaches lean on pre-built Grafana dashboards and fixed alert thresholds. But this causes problems:
Context Blindness: Your Kubernetes Grafana dashboard might show high CPU, but figuring out if it’s a bad HPA setting, resource limits, or a noisy neighbor means digging through multiple sources.
Alert Fatigue: Fixed thresholds mean either too many false alarms or missed issues. A spike in pod restarts might be fine during a deployment but critical otherwise.
Investigation Overhead: Engineers waste time switching between dashboards, metrics, and logs to get the full story.
Common Ways to Monitor Kubernetes with Prometheus and Grafana
Before diving into how AI changes Kubernetes monitoring, let’s look at the standard methods most teams use:
Prometheus Scraping with Grafana Dashboards
This basic setup involves Prometheus integration with Kubernetes through its service discovery capabilities, with Grafana visualizing this data through pre-built or custom dashboards. You usually deploy Prometheus with Helm charts like kube-prometheus-stack and point Grafana to Prometheus. It works for basic visibility, but takes lots of YAML config, and bad scrape jobs mean missing metrics. Engineers also have to jump between dashboards to connect related info.
ServiceMonitor and PodMonitor Configuration
Teams using the Prometheus Operator define ServiceMonitor or PodMonitor custom resources (CRDs) to target specific services or pods for metrics. This Prometheus Grafana workflow gives more control but adds complexity in managing these CRDs. Getting the label selectors right is tricky, and mistakes mean missed metrics. Debugging CRDs can frustrate teams without deep K8s knowledge. It’s powerful, but still results in static visuals that need human interpretation.
Kube-State-Metrics Integration
Kube-state-metrics provides cluster state data (pod status, deployments) that Prometheus collects and Grafana shows. This adds operational state info to your Kubernetes monitoring but can create too many metrics (high cardinality) for Prometheus, needing careful filtering. Teams often struggle with the sheer volume of data, making it hard to spot real signals.
Custom Application Metrics with Exporters
For app-specific insights, teams add custom metrics using Prometheus client libraries, which are scraped and shown alongside system metrics. This adds business context but requires development effort. Maintaining exporters gets harder as apps change, and failures can stop data collection. It gives valuable insights but adds operational work.
Challenges with Traditional Kubernetes Monitoring Workflow Setups
Even with these methods for monitoring Kubernetes with Prometheus and Grafana, teams hit limits:
Metric Overload: As clusters grow, the number of metrics gets overwhelming, making it hard to find what matters during an incident.
Static Visualization: Traditional Grafana dashboards don’t adapt to changing conditions or highlight new patterns automatically.
Manual Correlation: Engineers have to manually connect data between dashboards, logs, and events to understand the context.
Configuration Drift: Dashboard setups often get out of sync with the actual cluster, leading to confusing or wrong visuals.
Knowledge Silos: Creating and understanding dashboards often relies on specific team members, creating bottlenecks when they’re not around.
Enter Hawkeye: Your AI-Powered Kubernetes Expert
Instead of ditching your Grafana and Prometheus setup, Hawkeye works with them, acting as a smart layer that understands the complex relationships in your Kubernetes environment. It fits right into your existing observability stack, adding value through AI-powered analysis.
With Hawkeye, your team gets the best of both: Grafana’s great dashboards and Prometheus’s solid metrics collection, boosted by AI insights that automatically connect and interpret data from all your tools.
Intelligent Investigation: How Hawkeye Improves Kubernetes Observability
When something might be wrong in your Kubernetes environment, Hawkeye jumps in automatically, using data from your existing monitoring tools:
Cross-Source Analysis: Hawkeye doesn’t just look at isolated metrics; it correlates data across Prometheus metrics, Kubernetes events, logs, and configuration changes to build a comprehensive understanding of the situation.
Pattern Recognition: By learning what’s normal for your specific Kubernetes clusters, Hawkeye can spot anomalies that traditional alerts might miss but could signal upcoming problems.
Root Cause Identification: Instead of just showing symptoms, Hawkeye traces issues back to their source, separating primary causes from downstream effects.
This smart analysis takes seconds, giving engineers a complete picture instead of scattered metrics on different dashboards. Hawkeye also keeps learning from each investigation, getting better at spotting patterns specific to your setup.
Transforming Kubernetes Operations Workflow
The change in daily Kubernetes monitoring is huge. Compare the old way with Hawkeye’s approach:
Traditional Kubernetes Monitoring Workflow
An alert fires from Prometheus.
An engineer starts investigating.
The engineer clicks through multiple Kubernetes dashboards.
The engineer manually checks pod logs, K8s events, and recent changes.
After a lot of time connecting info, the engineer finds the root cause.
The engineer fixes it and monitors.
This usually takes 30-60 minutes, while the problem might get worse.
Hawkeye-Enhanced Workflow
An alert fires from Prometheus.
Hawkeye instantly analyzes metrics, logs, events, and config data.
Hawkeye identifies the root cause and affected parts.
Hawkeye provides a full analysis with specific recommendations.
The engineer reviews Hawkeye’s analysis and applies the fix.
The engineer checks the fix using existing Grafana dashboards.
This cuts investigation time by 70-80%, allowing faster fixes and less impact. It changes the engineer’s role from data detective to strategic problem solver.
Real-World Example: Pod Scheduling Issues
Think about a common problem: Services are slow, and your Grafana dashboards show lots of pending pods. Traditionally, you’d have to:
Check node resource use across the cluster.
Look at scheduler logs for failed attempts.
Review pod events and specs.
Analyze past trends for capacity patterns.
Investigate recent config changes.
Hawkeye changes this by:
Instantly connecting pod scheduling failures with resource issues.
Spotting patterns in node use and pod placement.
Analyzing the impact of recent deployments.
Suggesting specific fixes, like changing quotas or scaling nodes.
Learning from each investigation to give better insights over time.
Getting Actionable Kubernetes Insights with AI Prompting
To get the most from an AI assistant like Hawkeye for Kubernetes monitoring, asking good questions is key. Here are some effective prompts:
For cluster health:
“What’s causing the increased pod restart rates in the payment namespace?”
“Are there any nodes experiencing unusual resource pressure compared to historical patterns?”
“Which deployments have the biggest gap between requested and actual resource usage?”
For optimization:
“Identify pods with suboptimal resource requests based on historical usage patterns”
“Which services would benefit most from horizontal pod autoscaling based on traffic patterns?”
“Are there any worker nodes that could be downsized without affecting performance?”
These targeted questions use Hawkeye’s ability to connect data across your Kubernetes monitoring stack, providing insights hard to get from dashboards alone. Learn more in our Prometheus prompting guide.
Where Hawkeye really makes a difference is moving from just reacting to problems to proactively optimizing things:
Predictive Capacity Planning: By looking at past trends, Hawkeye can suggest node pool changes before resource limits cause problems.
Configuration Optimization: Hawkeye continuously checks pod specs and resource use to suggest better requests, limits, and HPA settings.
Pattern Recognition: As Hawkeye learns your environment, it can spot potential issues before they even trigger alerts.
The Future of Kubernetes Operations
As Kubernetes setups get more complex, relying only on dashboards isn’t sustainable. By combining Hawkeye’s AI analysis with your existing Grafana and Prometheus tools, teams can shift from constantly fighting fires to proactively making things better.
The impact goes beyond just being more efficient:
Reduced MTTR: Problems get fixed faster.
Less Alert Fatigue: Engineers get fewer, more meaningful alerts with context.
Better Resource Use: Clusters run more efficiently.
Increased Team Capacity: Engineers focus on improvements, not digging through data.
Getting Started
Implementing Hawkeye alongside your existing Kubernetes monitoring with Prometheus and Grafana tools is straightforward. Hawkeye’s integration capabilities mean you can connect it to your entire observability stack, creating a unified intelligence layer across all your tools.
Connect your telemetry sources:
Prometheus metrics
Container logs
Kubernetes events
Configuration management tools
Define your operational preferences and SLOs
Start benefiting from Hawkeye’s intelligent analysis and recommendations
Ready to see how Hawkeye can transform your Kubernetes operations?
Set up secure, read-only connections to your Kubernetes monitoring stack
Start a project within Hawkeye to leverage your existing metrics
Begin receiving AI-powered insights within minutes
Check our demo or contact us to learn how we can help your team break free from dashboard limitations and achieve new levels of operational excellence with your Kubernetes environment.
FAQ
What is Grafana?
Grafana is an open-source tool for visualizing data. For Kubernetes, it provides dashboards to see cluster performance, resource use, and application metrics. Grafana dashboards let teams track everything from node CPU/memory to pod performance. Learn more.
What is Prometheus?
Prometheus is an open-source monitoring tool designed for reliability. Prometheus integration with Kubernetes collects time-series data from clusters. It scrapes metrics from targets, great for dynamic environments like Kubernetes. Learn more.
What is Prometheus and Grafana in Kubernetes?
In Kubernetes, Prometheus and Grafana are often used together for monitoring. Prometheus collects metrics from Kubernetes components (nodes, pods) and stores them. Grafana visualizes this data on dashboards. Together, they help teams monitor health, resource use, and performance.
What is the difference between Grafana and Prometheus?
Monitoring Kubernetes with Prometheus and Grafana makes a strong stack:
SRE teams are constantly battling against time when it comes to incident resolution. Every minute of downtime can translate to significant financial losses and reputational damage.
The numbers tell a striking story: SRE teams today spend up to 70% of their time investigating and responding to incidents, leaving precious little bandwidth for innovation and systemic improvements. In a world where system complexity grows exponentially, this reactive approach isn’t just unsustainable—it’s holding organizations back from their true potential.
This reality exists despite having powerful tools like Datadog and ServiceNow at our disposal. These platforms represent the pinnacle of modern observability and incident management, yet teams still struggle to keep pace with increasing demand. The challenge isn’t with the tools themselves—it’s with how we use them. To make things worse, most organizations have more than one observability tool, so SRE teams rarely have all the info they need in one place.
The Challenge of Fragmented Observability
While Datadog and ServiceNow are powerful tools individually, many organizations face challenges in integrating them effectively. Often, different teams prefer different tools, leading to a fragmented observability landscape. Application metrics might reside in Datadog, while infrastructure logs are sent to CloudWatch, and security events are tracked in another platform. This forces engineers to use multiple interfaces, manually connect data, and waste time piecing together an incident.
The results are:
Data sources that don’t connect because different teams use different observability tools.
Manually merging data from Datadog with incident details in ServiceNow slows down incident response.
Missing key context, making it hard to find the root cause.
The Standard Integration Methods: Common Datadog & ServiceNow Approaches
The usual ways to connect ServiceNow to Datadog involve webhooks and RESTful APIs, along with using integration platforms for automation.
Datadog API ServiceNow Integration
ServiceNow’s REST API can be used to create, update, or query records based on data from Datadog. This method often requires scripting to parse incoming payloads and map fields appropriately.
Webhooks and Alerting Rules
Datadog can send real-time notifications to ServiceNow when specific events or alerts are triggered. This involves configuring a webhook in Datadog to send alerts to ServiceNow and creating an inbound REST message in ServiceNow to receive and process these alerts.
Service Graph Connector for CMDB Enrichment
Datadog can enrich logs and events with data from ServiceNow’s Configuration Management Database using the Service Graph Connector.
Host and Service Tagging via CMDB Queries
Datadog tags can be synchronized with ServiceNow CMDB data to maintain consistency and provide context for incident management.
Third-Party Integration Platforms
Third-party platforms facilitate Datadog-ServiceNow integration with pre-built connectors and no-code/low-code workflows. Yet these integration do not fully capture the nuances of your unique environment.
Hitting the Limits: Challenges with Conventional ServiceNow Datadog Integrations
Even with standard integrations in place, organizations run into issues.
Manual Context Gathering
Basic alerts or incidents lack full context, forcing SREs to log into multiple systems to get the whole picture.
Static and Rigid Workflows
Fixed rules can’t handle dynamic environments, leading to misrouted incidents or slow responses.
Insufficient Incident Details
Auto-created tickets might miss key metadata, like recent changes or connections.
Alert Fatigue
Too many alerts without smart filtering lead to noise, pulling attention from high-priority incidents.
Maintenance Overhead
Custom integrations often require constant updates to accommodate evolving IT landscapes.
Meet Hawkeye: Bridging the Gap with Generative AI for Datadog ServiceNow Integration
Hawkeye acts as an intelligent bridge between Datadog and ServiceNow, leveraging the power of Generative AI to automate tasks, enhance insights, and streamline workflows. Here’s how Hawkeye transforms the way SREs work with Datadog ServiceNow integration:
Automated Data Correlation
Hawkeye automatically correlates data from Datadog and ServiceNow, eliminating the need for manual cross-referencing. For example, when an alert is triggered in Datadog, Hawkeye can automatically create an incident in ServiceNow, populate it with relevant context from Datadog, and assign it to the appropriate team.
This multi-tool correlation happens in seconds, not the minutes or hours it would take a human engineer to manually gather and analyze data from each platform. More importantly, Hawkeye learns the relationships between different data sources, understanding which tools typically provide the most relevant information for specific types of incidents.
Intelligent Alerting
Hawkeye analyzes historical incident data and learns to identify patterns and anomalies. This allows it to filter out noise and prioritize alerts based on severity and context, reducing alert fatigue and ensuring that critical issues are addressed promptly. This is particularly valuable in a Datadog ServiceNow integration, where a high volume of alerts can easily overwhelm SRE teams.
Root Cause Analysis
Hawkeye goes beyond simply correlating data by performing automated root cause analysis. By analyzing metrics, logs, and traces from Datadog, combined with incident data from ServiceNow, Hawkeye can pinpoint the root cause of an issue, accelerating resolution times. This capability is crucial for efficient Datadog ServiceNow event management.
For common incidents, Hawkeye can automatically trigger remediation actions, such as restarting services or scaling resources. This minimizes downtime and frees up SREs to focus on more complex issues. This automation capability further enhances the value of Datadog ServiceNow integration.
Transforming Datadog and ServiceNow Incident Management and Response Workflow
Let’s consider a scenario where a critical application experiences a sudden spike in latency. In a traditional workflow, an SRE would need to:
Receive an alert from Datadog.
Log in to Datadog to investigate the issue.
Manually correlate metrics, logs, and traces to identify the root cause.
Create an incident in ServiceNow.
Update the incident with findings from Datadog.
Assign the incident to the appropriate team.
With Hawkeye, this process is streamlined and automated:
Hawkeye receives the alert from Datadog.
Hawkeye automatically correlates the alert with relevant data in Datadog and ServiceNow.
Hawkeye performs root cause analysis and identifies the source of the latency.
Hawkeye creates an incident in ServiceNow, populates it with relevant context, and assigns it to the appropriate team.
If the issue is common, Hawkeye may even trigger automated remediation actions.
Benefits of Datadog ServiceNow Integration with Hawkeye
Using Hawkeye does more than just improve incident response times. By automating tasks and giving insights, Hawkeye helps SREs to:
Reduce alert fatigue. By filtering out noise and prioritizing alerts, Hawkeye helps SREs focus on the most critical issues. Accelerate incident resolution. Automated data correlation and root cause analysis help SREs resolve incidents faster. Improve system stability. Predictive insights and automated remediation help prevent incidents and maintain system uptime. Increase efficiency. Automation frees up SREs from tedious manual tasks, allowing them to focus on more strategic work. Enhance collaboration. By providing a centralized platform for incident management and data analysis, Hawkeye improves collaboration between teams.
Unlocking Actionable Insights with Effective AI Prompting
“Talking” to an AI SRE teammate like Hawkeye requires asking and prompting the right questions. In a ServiceNow environment, consider AI prompts that help you understand the system’s pulse:
You might prompt GenAI “Which incidents are nearing their SLA breach time?” or “How many high-priority incidents are open in the last 24 hours?”. Similarly, for your ServiceNow change and release management, think about the impact of scheduled changes or the frequency of emergency modifications, all of which are crucial for maintaining service stability. Learn more in our ServiceNow prompting guide.
On the Datadog side, the focus shifts to real-time monitoring. Prompts like “What are the most frequent errors in my application logs?” or “What are the most common alerts in my environment?” give you a closer look at your traces to find bottlenecks. Learn more in our Datadog prompting guide.
How to Begin
Implementing Hawkeye alongside your existing tools is a straightforward process that begins paying dividends immediately. While this blog focuses on Datadog and ServiceNow, Hawkeye’s integration capabilities mean you can connect it to your entire observability stack, creating a unified intelligence layer across all your tools.
Adding Hawkeye into your observability stack is easy:
Set up read-only connections to Datadog and ServiceNow.
Start a project within Hawkeye, linking your data sources.
Start interactive investigations, using real-time insights.
Ready to experience the power of GenAI for your incident management workflows? Check our demo or contact us to see how Hawkeye can become your team’s AI-powered SRE teammate.
FAQs
What is Datadog?
Datadog is a cloud-based monitoring and analytics platform that provides organizations with real-time visibility into their IT infrastructure. It enables the monitoring of servers, databases, applications, and cloud services, offering insights into performance and potential issues. Datadog excels at collecting, searching, and analyzing traces across distributed architectures, which is crucial for maintaining system health and efficiency. It offers a wide range of capabilities, including application performance monitoring (APM), cloud and on-premise monitoring, and over 200 vendor-supported integrations. Learn more.
What is ServiceNow?
ServiceNow is a cloud-based platform that streamlines workflows across various departments within an organization. It specializes in IT service management (ITSM), IT operations management (ITOM), and IT business management (ITBM). ServiceNow excels at automating tasks, managing incidents, and tracking progress against service level agreements (SLAs). It provides a centralized system for managing IT operations, enabling efficient incident response and resolution. Learn more.
What is the difference between Datadog and ServiceNow? Should I use Datadog vs ServiceNow?
Rather than choosing one over the other, many organizations integrate both tools. This integration enables you to leverage Datadog’s robust observability to detect issues and ServiceNow’s structured processes to manage and resolve incidents.
Datadog is primarily a cloud-based monitoring and analytics platform designed to provide real-time visibility into your infrastructure, applications, and logs. It excels at collecting metrics, analyzing performance, and detecting anomalies across complex, distributed systems.
On the other hand, ServiceNow is a cloud-based IT service management (ITSM) platform focused on streamlining workflows, incident management, and change tracking. It automates the process of creating, categorizing, and managing incidents, ensuring that issues are tracked and resolved efficiently.
How forward-thinking SRE teams are revolutionizing their toolchain with Hawkeye
Site Reliability Engineering teams today deal with all sorts of complexity. Even with solid tools like Splunk for observability and ServiceNow for incident management, you might still find yourself stuck with fragmented workflows, battling alert fatigue, and switching context all the time. This mess not only drains productivity but also holds back innovation and proactive improvements.
But there’s gotta be a better way.
Here’s what happened with a Fortune 500 financial services company. Their SRE team made a big shift in managing complex IT infrastructure, not by hiring more folks, but by using Hawkeye, NeuBird’s GenAI-powered assistant. In just three months, their mean time to resolution dropped by a remarkable 45%. Now, they’ve managed to move from just putting out fires to actually focusing on reliability and making strategic improvements.
Let’s break down how Hawkeye is changing how Splunk and ServiceNow work together, improving SRE workflows, and boosting modern IT operations.
The Current Landscape: Powerful Tools, Complex Workflows
This story isn’t unique. You’ve likely felt the pain of a fragmented toolchain. Your logs sit in Splunk. Cloud data streams into CloudWatch. APM stuff hangs out in Datadog. Tickets live in ServiceNow. While these systems are powerful on their own, they often end up in silos, leaving you juggling dashboards and languages, stitching together pieces to figure things out.
The Standard Playbook: Common Splunk-ServiceNow Integration Methods
These methods offer a basic link, enabling simple alert-to-incident pipelines.
The Splunk Add-on for ServiceNow
The main, officially supported way from Splunk. It allows two-way communication, so Splunk can auto-create or update ServiceNow incidents based on Splunk alerts, and bring in ServiceNow data to add business context to Splunk data.
Splunk Workflow Actions
User-set, automated responses that start right from search results or as part of an alert’s actions. Often set to use the Splunk Add-on for ServiceNow, passing event data to start incident creation.
Splunk IT Service Intelligence (ITSI)
Modules that offer specific integration points with ServiceNow, linking service health issues or key events right to incident workflows.
Custom API Development
Integrations using Splunk and ServiceNow APIs. While very flexible, this usually means a lot of development and upkeep.
Hitting the Limits: Challenges with Conventional Integration
These integration approaches often run into limits, especially at scale:
Manual Triage Overload
Alerts sent to ServiceNow often lack enough context, forcing analysts to switch back to Splunk (or other tools) to investigate, gather info, and decide on priority and assignment.
Integrations usually use set rules for routing incidents, which might not handle changing infrastructure well, leading to mis-assigned tickets and delays.
Context Deficit in Tickets
Auto-created tickets might only have basic alert info. Adding related CIs, potential impact, past context, or suggested fixes often takes time.
Alert Fatigue and Noise
Without smart filtering before ticket creation, integrations can flood ServiceNow with low-priority alerts, creating noise and hiding key incidents.
Keeping field mappings and routing rules in the Splunk Add-on or custom scripts can get tricky as environments change.
You’ve probably dealt with these pain points firsthand. But things don’t have to stay this way.
Meet Hawkeye: Your GenAI SRE Teammate Linking Splunk and ServiceNow
Enter Hawkeye a smart Generative AI platform that doesn’t just bridge toolchains but makes them a lot better. Instead of turning your engineers into manual connectors, Hawkeye steps in as a proactive GenAI-powered partner. It doesn’t replace your tools; it helps them reach their full potential by:
Smartly querying Splunk logs and enriching ServiceNow incidents with vital context.
Correlating data and offering unified insights from your whole observability setup.
Getting smarter with every resolved issue.
Hawkeye’s architecture is built for speed, security, and seamless integration.
Ephemeral Intelligence Layer
Hawkeye processes data in real-time and purges all information post-analysis. Nothing is historically stored, preserving your data privacy.
Secure Data Access
Utilizes a finely-tuned AI language model to generate precise, accurate, and secure queries, like custom SPL, for pinpoint data retrieval from Splunk. Queries run in isolated, temporary environments ensuring no modifications to your data or systems.
Beyond Simple Integration: How Hawkeye Improves Splunk and ServiceNow
Hawkeye’s approach to tool integration goes far beyond simple API connections. When investigating an incident, it can simultaneously analyze Splunk logs using complex SPL queries, correlate findings with historical ServiceNow tickets, and gather context from other observability tools, in seconds. It also learns from each use, creating a knowledge base that makes future investigations faster.
What makes Hawkeye particularly powerful is its ability to:
It auto-generates specific SPL searches, gathering relevant data from Splunk upfront.
Correlates incidents with historical indicators, even when search parameters aren’t crystal clear.
Adds data on relevant CIs, history, impact, and key SLAs.
Offers human-readable analyses and recommended steps for each incident.
For Splunk, it can query, “What errors have occurred in my application logs in the last hour?” generating an SPL command like index=app_logs error | stats count by source and follow up with, “These errors spiked 50% above normal, likely due to a recent deployment”.
For ServiceNow, it tackles questions like, “Which incidents are nearing their SLA breach time?” or “Can we automate recurring service requests?” analyzing patterns to suggest, “These five incidents recur monthly; automating them could save 10 hours weekly”.
This chain-of-thought approach introduces meaningful narrative into raw telemetry and incident data, continuously escalating accuracy as it learns from each event it encounters.
The Transformed Workflow: Better Splunk and ServiceNow Incident Response
Hawkeye improves incident response by making workflows smoother and giving engineers AI-driven insights.
Traditional workflows require engineers to:
Receive a ServiceNow ticket
Construct multiple Splunk queries
Analyze log patterns
Correlate findings across tools
Document everything back in ServiceNow
With Hawkeye, engineers start with a single view of the problem and all the info to fix it in one root cause analysis. Routine issues are fixed by using the recommended steps, while complex problems have detailed summaries that include data from your observability stack.
Hawkeye Workflow:
An incident is reported in ServiceNow.
Hawkeye auto-analyzes the incident, creates SPL queries, and gets data from Splunk and other tools.
Hawkeye correlates findings, identifies root causes, and provides actionable recommendations.
Engineers review Hawkeye’s analysis, put solutions in place, and work to prevent future issues.
This makes the engineer a strategic problem solver, not just a data gatherer.
The Future of SRE: From Surviving to Strategy
Hawkeye’s impact on SRE teams goes beyond tech. With experienced SRE talent scarce and expensive, organizations are under pressure to keep systems reliable while managing costs. The traditional response, hiring more engineers, isn’t just expensive. It’s often not even possible given the limited talent pool.
Hawkeye changes this by automating routine investigations and giving smart analysis across your observability stack, multiplying the capacity of your team. This means you can handle system complexity without growing headcount as much. It also changes the SRE role, addressing things that cause burnout:
Engineers spend more time on intellectually engaging work like architectural improvements and capacity planning, rather than repetitive investigations.
The dreaded 3 AM wake-up calls become increasingly rare as Hawkeye handles routine issues autonomously (*roadmap, today it recommends an action plan).
New team members come up to speed faster, learning from Hawkeye’s accumulated knowledge base, and cross-training becomes easier as Hawkeye provides consistent, comprehensive investigation summaries.
For organizations, this means lower recruitment costs, better retention, and the ability to scale operations without scaling headcount, creating a cycle where happier engineers deliver better systems.
How to Begin
Adding Hawkeye to your tools is easy. While this blog focuses on Splunk and ServiceNow, Hawkeye’s integrations mean you can connect it to your whole observability stack, creating a unified intelligence layer across all your tools.
Ready to transform your fragmented toolchain into a unified, intelligent operations platform? Check our demo or contact us to see how Hawkeye can become your team’s AI-powered SRE teammate.
FAQ
What is Splunk used for?
Splunk excels at capturing, indexing, and correlating machine-generated data – logs, metrics, traces – turning raw information into valuable insights. It’s a powerhouse for:
Security Information and Event Management: Detecting and responding to security threats.
IT Operations Management: Monitoring infrastructure and application performance.
Business Analytics: Uncovering trends and patterns to drive better decision-making.
What is the difference between Splunk and ServiceNow? Should I use Splunk vs ServiceNow?
Splunk is mainly a data-to-everything platform for insight and observability. ServiceNow is mainly a digital workflow platform. The real value, as highlighted in this article, comes from linking Splunk and ServiceNow, allowing Splunk’s real-time insights and alerts to auto-start and improve workflows within ServiceNow, leading to faster fixes.
Splunk is a data-to-everything platform. Its strengths lie in ingesting, searching, analyzing, monitoring, and visualizing machine data from various sources (logs, metrics, traces, security events). Key use cases include SIEM, AIOps, observability, and complex troubleshooting.
ServiceNow is a digital workflow platform. Its core strengths lie in automating and managing IT and business processes. It is used as IT Service Management platform, IT Operations Management platform, CMDB, HR Service Delivery, and Customer Service Management.
Tired of those 3 AM wake-up calls caused by failed Step Functions workflows?
It’s 3 AM, and your phone lights up with another alert. A critical Step Functions workflow has failed, affecting customer orders worth millions. You dive into CloudWatch logs, trying to piece together what went wrong. Was it a timeout in that Lambda function? Did the downstream API fail? Maybe it’s related to that deployment from yesterday? As you switch between multiple browser tabs—CloudWatch metrics, logs, dashboards, ServiceNow tickets, deployment logs—you can’t help but think: “There has to be a better way.”
This scenario plays out in organizations every day, where Step Functions orchestrate mission-critical workflows processing millions of transactions. While Step Functions itself is incredibly reliable, the complexity of distributed workflows means that error handling and recovery remain significant challenges for even the most experienced SRE teams.
At Neubird, we understand the frustration and pressure that comes with managing mission-critical workflows in the cloud. Hawkeye allows teams to move from reactive troubleshooting to proactive optimization, fundamentally changing how they operate.
Not convinced? Let’s illustrate Hawkeye’s transformative capabilities with a real-world example. Care to learn more? Continue reading.
The Hidden Complexity of Modern Workflows
Today’s Step Functions workflows are far more complex than simple linear sequences. They typically involve:
Multiple Lambda functions with diverse runtime characteristics: Each function may have unique resource requirements and potential points of failure. For example, a memory-intensive function might be more prone to timeouts than a CPU-bound function.
Integration with various AWS services: Interactions with services like SQS, DynamoDB, and SageMaker introduce dependencies and potential error sources. Imagine a workflow where a Lambda function reads data from an SQS queue, processes it, and then writes the results to a DynamoDB table. A failure in any of these services can cause the workflow to fail.
Third-party API calls with varying reliability: External APIs can be unpredictable, with varying response times and error rates. For instance, an API call to a payment gateway might fail intermittently due to network issues or rate limiting.
Complex branching logic and parallel executions: Workflows with intricate logic and parallel paths can be challenging to debug when errors occur, especially when a failure in one part of the workflow might be triggered by an issue in a seemingly unrelated part due to hidden dependencies.
Data transformations and state management: Managing data flow and state across different steps adds another layer of complexity to error handling. If a data transformation step fails, it can corrupt the data and cause subsequent steps to fail.
Cross-region and cross-account operations: Distributed workflows spanning multiple regions or accounts introduce additional challenges for tracking and resolving errors. For example, if a workflow invokes a Lambda function in a different region, network latency or regional outages can cause failures.
When something goes wrong, the challenge isn’t just identifying the failed step—it’s understanding the entire context. Did retries exhaust because of a temporary network issue? Is there a pattern of failures during peak load? Are timeout configurations appropriate for current processing volumes? Learn more from AWS.
The Limitations of Traditional Approaches to Step Function Retry Logic
Current error handling strategies often rely on:
Basic retry configurations within AWS Step Functions: While Step Functions provides built-in retry mechanisms, these are often insufficient for handling complex failure modes. These mechanisms include configuring retriers with options like “Interval” to specify the time before the first retry, “Max attempts” to limit the number of retries, and “Backoff rate” to control how the retry interval increases with each attempt. However, these basic configurations may not be enough to address intricate failure scenarios, such as when a Lambda function fails due to a dependency on a third-party API that is experiencing intermittent outages. At Neubird, we’ve encountered numerous situations where basic retry logic simply wasn’t enough.
Catch states with simple error routing: Catch states can redirect workflow execution upon error, but they may not provide enough context for effective remediation. For example, a catch state might simply log the error and terminate the workflow, without providing insights into the underlying cause or suggesting potential solutions.
CloudWatch alarms on failure metrics: Alarms can notify you of failures, but they often lack the granularity needed to pinpoint the root cause. Read how Hawkeye can transform your CloudWatch ServiceNow integration for more ideas.
Manual investigation of execution histories: Manually reviewing execution histories can be time-consuming and inefficient, especially for complex workflows with numerous steps and branches.
Custom logging solutions: While custom logging can provide valuable insights, it often requires significant development effort and may not be comprehensive enough.
While these approaches work for simple scenarios, they fall short when dealing with complex failure modes:
Hidden Dependencies: A timeout in one branch of a parallel execution might stem from resource contention in another branch, making it difficult to identify the true root cause.
Cascading Failures: Retry storms, where a failed step triggers a cascade of retries across dependent services, can overwhelm downstream systems and exacerbate the problem. For instance, if a Lambda function fails and retries repeatedly, it might flood an SQS queue with messages, causing delays and potentially impacting other workflows that depend on that queue.
Inconsistent State: Failed workflows can leave systems in an inconsistent state, requiring manual intervention to restore data integrity and resume operations.
Alert Fatigue: Generic failure alerts provide minimal context, leading to alert fatigue and delayed responses. If you receive a generic alert that simply states “Step Functions workflow failed,” it doesn’t give you much information to work with, and you might be tempted to ignore it if you’re already dealing with numerous other alerts.
Furthermore, it’s important to understand how Step Functions handles retries in the context of “redriven executions” (where a failed execution is restarted). When a redriven execution reruns a task or parallel state with defined retries, the retry attempt count for those states is reset to 0. This ensures that the maximum number of retries are still allowed, even if the initial execution had already exhausted some retry attempts.
Transforming Error Handling with Hawkeye: Beyond Basic Step Function Retry
Imagine walking in tomorrow to find:
Detailed analysis of failure patterns already completed
Correlated events across your entire AWS environment
Precise identification of root causes
Recommended configuration adjustments
Automated recovery for known failure patterns
This isn’t science fiction—it’s what leading SRE teams are achieving with Hawkeye as their AI-powered teammate.
The Hawkeye Difference: A Real-World Investigation of Step Function Retry and Catch
Following up on the real-world example. An e-commerce platform’s critical order processing workflow began failing intermittently during peak hours. The Step Functions execution showed a series of Lambda timeouts, leading to failed customer transactions and a growing support queue.
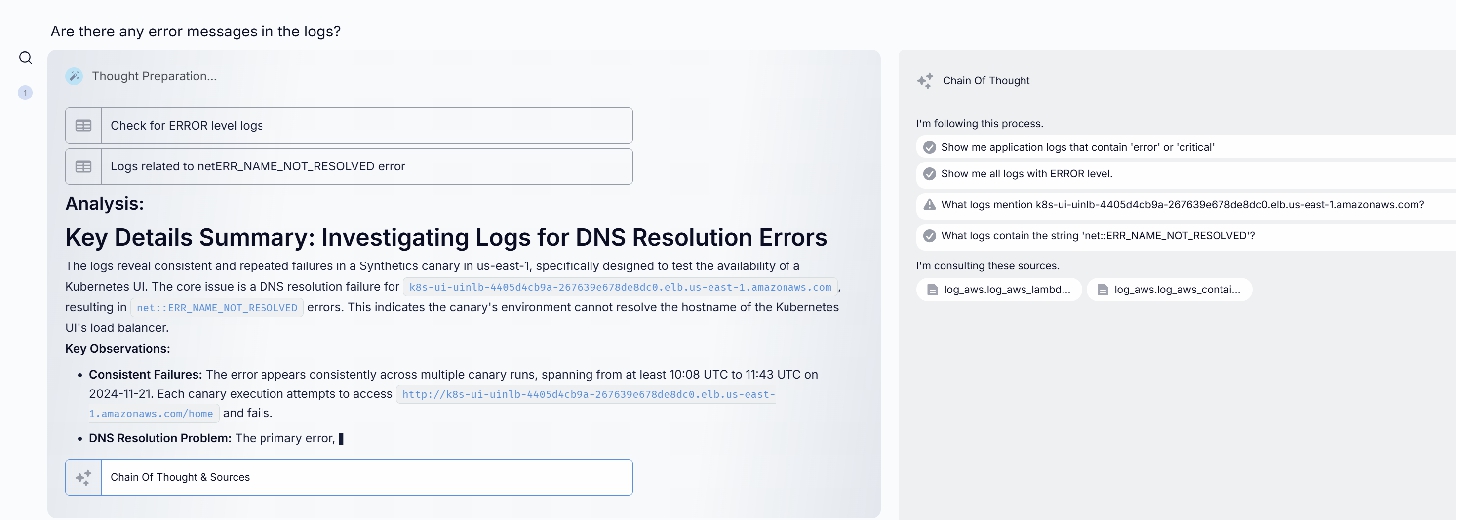
Here’s how Hawkeye analyzed the incident:
When the alert came in, Hawkeye immediately began its analysis, producing this detailed investigation.
Within minutes of implementing these recommendations, the success rate returned to normal levels. More importantly, Hawkeye’s analysis helped prevent similar issues across other workflows by identifying potential bottlenecks before they impacted customers.
Moving from Reactive to Proactive
The true transformation comes from Hawkeye’s ability to learn and improve over time. As it analyzes each incident, it builds a deeper understanding of your workflow patterns and their dependencies. This learning translates into proactive recommendations that help prevent future failures. For instance, after resolving the e-commerce platform’s timeout issues, Hawkeye began monitoring similar patterns across all Step Functions workflows, identifying potential bottlenecks before they impacted production.
This shift from reactive troubleshooting to proactive optimization fundamentally changes how SRE teams operate. Instead of spending nights and weekends debugging complex workflow failures, teams can focus on architectural improvements and innovation. The continuous refinement of Hawkeye’s analysis means that each incident makes your system more resilient, not just through immediate fixes but through deeper architectural insights.
Hawkeye Implementation Journey
Integrating Hawkeye into your Kubernetes environment is straightforward:
Connect your existing observability tools – Hawkeye enhances rather than replaces your current monitoring stack. You can connect Hawkeye to CloudWatch, ServiceNow, Datadog, and other popular monitoring tools.
Configure your preferred incident response workflows.
Review Hawkeye’s incident analysis, drill down with questions, and implement recommendations. Hawkeye provides detailed reports and visualizations that help you quickly grasp the situation and take appropriate action. You can also ask Hawkeye questions about the incident, such as “What were the contributing factors?” or “What are the recommended mitigation steps?”.
The Future of Workflow Reliability
As cloud architectures become more complex, the old approach of adding more dashboards and alerts simply won’t scale. Forward-thinking teams are embracing AI not just as a tool, but as an intelligent teammate that can understand, learn, and improve over time.
Ready to transform how your team handles Step Functions failures? Contact us to see how Hawkeye can become your AI-powered SRE teammate and help your organization master complex workflow reliability.
How forward-thinking SRE teams are tackling cloud complexity with Hawkeye
Enterprise AWS environments generate millions of monitoring data points daily across thousands of resources, instances, containers, and serverless functions. AWS CloudWatch alone tracks extensive metrics per service, compounding complexity when adding microservices, auto-scaling, and ephemeral resources. Effectively managing the operational data from these components, often tracked within ServiceNow microservices configurations or CMDBs, becomes critical. When incidents occur, SRE teams face intense pressure to pinpoint issues rapidly, but traditional manual correlation methods between CloudWatch and ServiceNow incidents cannot effectively scale.
Traditional approaches of manually correlating CloudWatch metrics with ServiceNow incidents simply can’t keep pace with this exponential growth in complexity. More dashboards, better alerts, and additional automation rules only add to the cognitive load, they don’t address the fundamental challenge of scale.
The challenge isn’t that CloudWatch fails to capture essential data or that ServiceNow lacks strong incident-management features. It is that human engineers, no matter how skilled, cannot process and correlate this volume of information at the speed required by modern cloud operations. Adding to this complexity, most organizations run hybrid or multi-cloud environments, meaning CloudWatch is just one of several observability tools teams need to master.
Consider a global e-commerce organization managing widespread AWS deployments. Their Site Reliability Engineers (SREs) sift through thousands of alerts weekly, manually creating ServiceNow incidents and correlating CloudWatch metrics across varied regions. The result: persistent alert fatigue, delayed responses, and costly errors.
The Cloud-Native Monitoring Challenge: Bridging the Gap Between AWS CloudWatch and ServiceNow
Today’s cloud environments are different from traditional infrastructure. They’re dynamic, with resources starting and stopping automatically, services scaling on demand, and configurations changing in real-time. CloudWatch captures this with:
Detailed metrics for every AWS service
Custom metrics from applications
Container insights
Lambda function telemetry
Log data from multiple sources
ServiceNow brings order to this chaos through:
Automated incident creation
Workflow management
Change tracking
Configuration management
Service mapping
Yet the gap between these tools gets bigger as cloud environments get more complex. Your engineers have to switch between tools, manually connect data, and piece together what’s happening across your infrastructure.
The Standard Integration Methods: Common AWS & ServiceNow Approaches
ServiceNow offers tools to connect with AWS services, from direct APIs and solutions like the AWS ServiceNow Connector to using AWS Systems Manager OpsCenter or custom AWS Lambda functions.
AWS CloudWatch Alarms with ServiceNow Integration
CloudWatch alarms start basic incident creation in ServiceNow but don’t give much detail beyond the alarm.
AWS Systems Manager OpsCenter Integration
Connects alerts from CloudWatch to ServiceNow incidents, enabling basic issue tracking.
AWS Lambda ServiceNow Integration
AWS Lambda allows custom integrations between AWS CloudWatch and ServiceNow, adding detail to incident data before sending it to ServiceNow. While flexible, these integrations take a lot of development and upkeep.
AWS Connect ServiceNow Integration
AWS Connect integrates with ServiceNow to automatically log incidents from customer interactions, making workflows smoother by connecting customer data with structured incident management.
Custom API and Integration Tools
Tailored API-driven integrations with flexibility but a lot of maintenance.
Hitting the Limits: Challenges with Conventional Integrations
These standard integration methods frequently run into scalability and operational challenges:
Manual Context Gathering
Basic alarms and incidents lack detail, forcing engineers to switch between CloudWatch, AWS consoles, and ServiceNow for analysis.
Fixed rules for incident routing often don’t handle cloud-native operations well, resulting in incidents being assigned wrong and taking longer to resolve.
Insufficient Incident Context
Auto-created tickets usually have limited info, missing key details like resource dependencies, recent changes, or past context.
Alert Fatigue and Noise
Without smart filtering, integrations flood ServiceNow with low-priority alerts.
Complex and Costly Maintenance
Keeping custom integrations updated gets tricky and costly as infrastructure changes.
These pain points significantly limit the effectiveness of current AWS CloudWatch ServiceNow integration methods, but there’s a better way.
Meet Hawkeye: Your GenAI SRE Teammate Linking AWS CloudWatch and ServiceNow
NeuBird’s Hawkeye, a GenAI-powered solution, improves this integration by processing and connecting data quickly. Hawkeye enhances CloudWatch and ServiceNow.
Hawkeye leverages advanced GenAI capabilities to:
Automatically identify relationships and dependencies across AWS microservices and cloud-native operations.
Correlate CloudWatch metrics across different time scales and services.
Detect patterns in auto-scaling and identify resource constraints affecting performance.
Trace configuration changes directly linked to performance impacts.
Provide proactive recommendations for cost optimization.
This analysis happens in seconds, not the minutes or hours it would take a human engineer to gather and process the same information. Hawkeye continually learns from each incident to refine future responses without compromising data privacy or security.
Beyond Simple Integration: How Hawkeye Improves CloudWatch and ServiceNow
Hawkeye’s integration does more than basic API connections. Hawkeye:
Auto-generates targeted CloudWatch metric queries, extracting relevant data upfront.
Correlates new incidents with historical indicators, even when initial search parameters are unclear.
Enriches incident tickets with comprehensive context, including resource dependencies, recent configuration changes, and impact assessments.
Provides detailed, human-readable analyses along with actionable recommendations for resolving each incident.
For CloudWatch, Hawkeye can quickly answer, “What caused recent spikes in API Gateway latency?” and make precise metric searches, adding insights such as, “Latency spikes connect to a recent Lambda deployment impacting memory.”
For ServiceNow, it quickly handles questions such as, “Which incidents are nearing SLA breaches?” and advises solutions, finding incidents that recur and suggesting automation.
This structured, narrative-driven, chain-of-thought approach transforms raw telemetry data into actionable insights, continually refining accuracy through iterative learning.
Transforming CloudWatch and ServiceNow Incident Management Workflow
The change in daily operations is big. Typical manual workflow today:
Monitor multiple CloudWatch dashboards
Switch between different AWS service consoles
Manually correlate metrics with incidents
Document findings in ServiceNow
Track down related changes and configurations
With Hawkeye’s assistance, your engineers:
Start with a unified view of the issue.
Receive all necessary information for resolving incidents in a single coherent root cause analysis.
Easily resolve routine issues through clearly outlined recommended actions.
Obtain detailed investigation summaries for complex problems, including relevant contextual data from across the cloud environment.
Shift their role from data gatherers to strategic problem solvers.
The Future of Cloud Operations: From Reactive to Proactive
By automating and enriching incident analysis, Hawkeye significantly reduces firefighting burdens. With more intelligent insights, SREs can shift toward proactive improvement and strategic operations. Engineers can confidently delegate routine troubleshooting; meanwhile, issues that arise overnight become less frequent and disruptive. Your newest hires ramp up faster thanks to instantly available context and detailed analyses from previous incidents.
How to Begin
Implementing Hawkeye alongside your existing tools is a straightforward process that begins paying dividends immediately. While this blog focuses on CloudWatch and ServiceNow, Hawkeye’s integration capabilities mean you can connect it to your entire observability stack, creating a unified intelligence layer across all your tools.
Adding Hawkeye into your observability stack is easy:
Set up read-only connections to AWS and ServiceNow.
Start a project within Hawkeye, linking your data sources.
Start interactive investigations, using real-time insights.
Want to transform your cloud operations? Play with our demo or contact us to see how Hawkeye can become your team’s AI-powered SRE teammate and help your organization tackle the complexity of modern cloud environments.
FAQ
What is AWS CloudWatch
CloudWatch is a monitoring and observability service built for AWS cloud resources and applications. It provides data and actionable insights to monitor applications, respond to system-wide performance changes, optimize resource utilization, and get a unified view of operational health. Learn more.
What is ServiceNow
ServiceNow is a cloud-based platform that helps companies manage digital workflows for enterprise operations. It excels at IT service management (ITSM), providing features like incident management, problem management, and change management. Learn more.
How does ServiceNow compare to AWS?
ServiceNow focuses on IT service management, offering features like incident creation, workflow automation, and change tracking. AWS, on the other hand, specializes in cloud infrastructure monitoring through tools like CloudWatch. Together, they complement each other by combining observability with structured incident management workflows.