Transform your Kubernetes Monitoring with Prometheus and Grafana
How SRE teams are evolving their Kubernetes observability with AI, combining Prometheus and Grafana with intelligent analysis.

How SRE teams are evolving their Kubernetes observability with AI
Your team has spent tons of hours building that perfect Grafana dashboard for Kubernetes monitoring. You've got detailed panels for CPU spikes, memory, network metrics, and alerts set up through Prometheus. But when a critical service starts acting up, your engineers still spend way too much time digging through dashboards, trying to connect metrics, and scanning logs to figure out what’s actually going on. Sound familiar? You're not the only one. While Grafana gives you great visuals for Kubernetes monitoring and Prometheus is solid for collecting metrics, the sheer complexity of Kubernetes has created a big problem: People just can't process and connect all that data fast enough for modern cloud-native operations.
The Hidden Costs of Relying Only on Dashboards
Today's Kubernetes setups generate a massive amount of data. A typical production cluster might track:
- Thousands of metrics across hundreds of pods
- Multiple node pools with varying resource configurations
- Complex autoscaling behaviors
- Intricate service dependencies
- Network policies and security configurations
Traditional approaches lean on pre-built Grafana dashboards and fixed alert thresholds. But this causes problems:
- Context Blindness: Your Kubernetes Grafana dashboard might show high CPU, but figuring out if it's a bad HPA setting, resource limits, or a noisy neighbor means digging through multiple sources.
- Alert Fatigue: Fixed thresholds mean either too many false alarms or missed issues. A spike in pod restarts might be fine during a deployment but critical otherwise.
- Investigation Overhead: Engineers waste time switching between dashboards, metrics, and logs to get the full story.
Common Ways to Monitor Kubernetes with Prometheus and Grafana
Before diving into how AI changes Kubernetes monitoring, let's look at the standard methods most teams use:
Prometheus Scraping with Grafana Dashboards
This basic setup involves Prometheus integration with Kubernetes through its service discovery capabilities, with Grafana visualizing this data through pre-built or custom dashboards. You usually deploy Prometheus with Helm charts like kube-prometheus-stack and point Grafana to Prometheus. It works for basic visibility, but takes lots of YAML config, and bad scrape jobs mean missing metrics. Engineers also have to jump between dashboards to connect related info.
ServiceMonitor and PodMonitor Configuration
Teams using the Prometheus Operator define ServiceMonitor or PodMonitor custom resources (CRDs) to target specific services or pods for metrics. This Prometheus Grafana workflow gives more control but adds complexity in managing these CRDs. Getting the label selectors right is tricky, and mistakes mean missed metrics. Debugging CRDs can frustrate teams without deep K8s knowledge. It's powerful, but still results in static visuals that need human interpretation.
Kube-State-Metrics Integration
Kube-state-metrics provides cluster state data (pod status, deployments) that Prometheus collects and Grafana shows. This adds operational state info to your Kubernetes monitoring but can create too many metrics (high cardinality) for Prometheus, needing careful filtering. Teams often struggle with the sheer volume of data, making it hard to spot real signals.
Custom Application Metrics with Exporters
For app-specific insights, teams add custom metrics using Prometheus client libraries, which are scraped and shown alongside system metrics. This adds business context but requires development effort. Maintaining exporters gets harder as apps change, and failures can stop data collection. It gives valuable insights but adds operational work.
Challenges with Traditional Kubernetes Monitoring Workflow Setups
Even with these methods for monitoring Kubernetes with Prometheus and Grafana, teams hit limits:
- Metric Overload: As clusters grow, the number of metrics gets overwhelming, making it hard to find what matters during an incident.
- Static Visualization: Traditional Grafana dashboards don't adapt to changing conditions or highlight new patterns automatically.
- Manual Correlation: Engineers have to manually connect data between dashboards, logs, and events to understand the context.
- Configuration Drift: Dashboard setups often get out of sync with the actual cluster, leading to confusing or wrong visuals.
- Knowledge Silos: Creating and understanding dashboards often relies on specific team members, creating bottlenecks when they're not around.
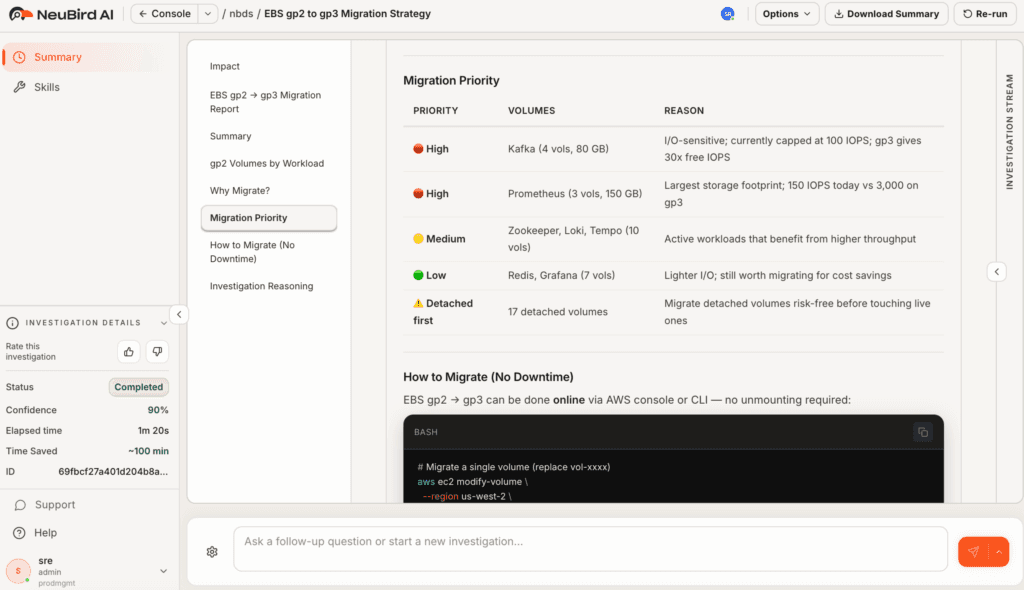
Enter Neubird: Your AI-Powered Kubernetes Expert
Instead of ditching your Grafana and Prometheus setup, Neubird works with them, acting as a smart layer that understands the complex relationships in your Kubernetes environment. It fits right into your existing observability stack, adding value through AI-powered analysis. With Neubird, your team gets the best of both: Grafana's great dashboards and Prometheus's solid metrics collection, boosted by AI insights that automatically connect and interpret data from all your tools.
Intelligent Investigation: How Neubird Improves Kubernetes Observability
When something might be wrong in your Kubernetes environment, Neubird jumps in automatically, using data from your existing monitoring tools:
- Cross-Source Analysis: Neubird doesn't just look at isolated metrics; it correlates data across Prometheus metrics, Kubernetes events, logs, and configuration changes to build a comprehensive understanding of the situation.
- Pattern Recognition: By learning what's normal for your specific Kubernetes clusters, Neubird can spot anomalies that traditional alerts might miss but could signal upcoming problems.
- Root Cause Identification: Instead of just showing symptoms, Neubird traces issues back to their source, separating primary causes from downstream effects.
This smart analysis takes seconds, giving engineers a complete picture instead of scattered metrics on different dashboards. Neubird also keeps learning from each investigation, getting better at spotting patterns specific to your setup.
Transforming Kubernetes Operations Workflow
The change in daily Kubernetes monitoring is huge. Compare the old way with Neubird's approach: Traditional Kubernetes Monitoring Workflow
- An alert fires from Prometheus.
- An engineer starts investigating.
- The engineer clicks through multiple Kubernetes dashboards.
- The engineer manually checks pod logs, K8s events, and recent changes.
- After a lot of time connecting info, the engineer finds the root cause.
- The engineer fixes it and monitors.
This usually takes 30-60 minutes, while the problem might get worse. Neubird-Enhanced Workflow
- An alert fires from Prometheus.
- Neubird instantly analyzes metrics, logs, events, and config data.
- Neubird identifies the root cause and affected parts.
- Neubird provides a full analysis with specific recommendations.
- The engineer reviews Neubird's analysis and applies the fix.
- The engineer checks the fix using existing Grafana dashboards.
This cuts investigation time by 70-80%, allowing faster fixes and less impact. It changes the engineer's role from data detective to strategic problem solver. AI SRE for production Kubernetes →
Real-World Example: Pod Scheduling Issues
Think about a common problem: Services are slow, and your Grafana dashboards show lots of pending pods. Traditionally, you'd have to:
- Check node resource use across the cluster.
- Look at scheduler logs for failed attempts.
- Review pod events and specs.
- Analyze past trends for capacity patterns.
- Investigate recent config changes.
Neubird changes this by:
- Instantly connecting pod scheduling failures with resource issues.
- Spotting patterns in node use and pod placement.
- Analyzing the impact of recent deployments.
- Suggesting specific fixes, like changing quotas or scaling nodes.
- Learning from each investigation to give better insights over time.
Read more: Check our tutorial on how to deal with pod scaling challenges, CrashLoopBackOff issues, or container image pull errors. Neubird gives contextual analysis that dashboards alone can't provide.
Getting Actionable Kubernetes Insights with AI Prompting
To get the most from an AI assistant like Neubird for Kubernetes monitoring, asking good questions is key. Here are some effective prompts: For cluster health:
- "What's causing the increased pod restart rates in the payment namespace?"
- "Are there any nodes experiencing unusual resource pressure compared to historical patterns?"
- "Which deployments have the biggest gap between requested and actual resource usage?"
For optimization:
- "Identify pods with suboptimal resource requests based on historical usage patterns"
- "Which services would benefit most from horizontal pod autoscaling based on traffic patterns?"
- "Are there any worker nodes that could be downsized without affecting performance?"
These targeted questions use Neubird's ability to connect data across your Kubernetes monitoring stack, providing insights hard to get from dashboards alone. Learn more in our Prometheus prompting guide.
Beyond Reactive Monitoring: Proactive Kubernetes Optimization
Where Neubird AI SRE really makes a difference is moving from just reacting to problems to proactively optimizing things:
- Predictive Capacity Planning: By looking at past trends, Neubird can suggest node pool changes before resource limits cause problems.
- Configuration Optimization: Neubird continuously checks pod specs and resource use to suggest better requests, limits, and HPA settings.
- Pattern Recognition: As Neubird learns your environment, it can spot potential issues before they even trigger alerts.
The Future of Kubernetes Operations
As Kubernetes setups get more complex, relying only on dashboards isn't sustainable. By combining Neubird's AI analysis with your existing Grafana and Prometheus tools, teams can shift from constantly fighting fires to proactively making things better. The impact goes beyond just being more efficient:
- Reduced MTTR: Problems get fixed faster.
- Less Alert Fatigue: Engineers get fewer, more meaningful alerts with context.
- Better Resource Use: Clusters run more efficiently.
- Increased Team Capacity: Engineers focus on improvements, not digging through data.
Getting Started
Implementing Neubird alongside your existing Kubernetes monitoring with Prometheus and Grafana tools is straightforward. Neubird’s integration capabilities mean you can connect it to your entire observability stack, creating a unified intelligence layer across all your tools.
- Connect your telemetry sources:
- Prometheus metrics
- Container logs
- Kubernetes events
- Configuration management tools
- Define your operational preferences and SLOs
- Start benefiting from Neubird's intelligent analysis and recommendations
Read more:
- See how you can transform your Datadog & PagerDuty Workflows
- or power-up your Splunk and ServiceNow SRE workflows
Take the Next Step
Ready to see how Neubird AI SRE can transform your Kubernetes operations?
- Set up secure, read-only connections to your Kubernetes monitoring stack
- Start a project within Neubird to leverage your existing metrics
- Begin receiving AI-powered insights within minutes
Book a demo or contact us to learn how we can help your team break free from dashboard limitations and achieve new levels of operational excellence with your Kubernetes environment.
Related Reading
- 2026 State of AI SRE Terminology - full AI SRE terminology reference