Datadog and PagerDuty Integration with GenAI: Every Minute Counts in Incident Response
How forward-thinking SRE teams are revolutionizing incident response with Neubird
Every minute matters in incident response. Yet SRE teams spend, on average, 23 minutes just gathering context before even starting to solve the problem. For a team handling dozens of incidents each week, this adds up to hundreds of hours spent collecting data, time that could be used for strategic improvements.
This issue persists despite using powerful tools like Datadog and PagerDuty. While Datadog provides wide visibility and PagerDuty ensures notifications reach the right people, teams still struggle with slow response times and burnout. The problem lies in how we’re using these tools, and the fact that most organizations have multiple observability tools, meaning engineers rarely have all the information they need when a PagerDuty alert shows up.
The Current Landscape: Why Your Datadog PagerDuty Workflow Still Falls Short
Today’s incident management setup is advanced, with PagerDuty handling on-call schedules and escalation, while Datadog provides real-time monitoring and alerts. Together, they’re meant to be a solid base for incident response.
However, companies often have tool sprawl, leading to application metrics being tracked in Datadog while infrastructure logs are sent to CloudWatch. When an alert fires, engineers have to navigate this complex setup, often under pressure to fix things quickly.
4 Standard Datadog and PagerDuty Integration Methods
Before exploring how GenAI transforms this landscape, let’s understand the common Datadog PagerDuty integration methods organizations typically implement:
Integration via PagerDuty Service (Direct Service-Level Integration)
Connects Datadog monitors directly to specific PagerDuty services using integration keys. You may configure Datadog to send alerts to PagerDuty using the @pagerduty-ServiceName syntax in monitor notifications. While the Datadog monitor PagerDuty integration is simple to set up, it doesn’t add much extra context and requires separate configuration for each service.
Global Event Routing (Event Orchestration)
More advanced teams use PagerDuty’s Global Event Routing to dynamically route Datadog monitor alerts based on content, tags, or severity. This offers more flexibility but still needs manual setup and maintenance.
API-Based Integration for Custom Workflows
Organizations that need control over their Datadog PagerDuty workflow often build custom integrations using both platforms’ APIs. This allows complex routing but takes a lot of development work and maintenance resources.
Datadog Apps Integration (UI Extensions)
PagerDuty’s UI extensions let engineers view and manage PagerDuty incidents right within Datadog dashboards, reducing the need to switch between tools. This helps responders stay within a single interface but doesn’t address the fundamental information gathering challenge.
Challenges with Conventional Datadog PagerDuty Integrations
Even with these integration options, SRE teams face issues:
- Alert Noise and Context Gaps: Datadog PagerDuty notifications often lack enough context, forcing engineers to gather information themselves.
- Static Workflows: Predefined routing rules can’t adapt to changing conditions.
- Maintenance Overhead: Custom integrations need constant upkeep.
- Priority and Severity Mapping: Datadog PagerDuty severity mapping can be challenging, as Datadog’s three-level system (ALERT, WARNING, INFO) doesn’t always align perfectly with PagerDuty’s urgency levels, potentially causing critical issues to receive inadequate attention or minor issues to trigger excessive escalation.
- Alert Volume Management: High volumes of notifications can overwhelm on-call engineers, especially when Datadog PagerDuty priority settings aren’t properly calibrated for business impact.
Enter Neubird: Your Integration-Savvy GenAI Teammate for Datadog and PagerDuty
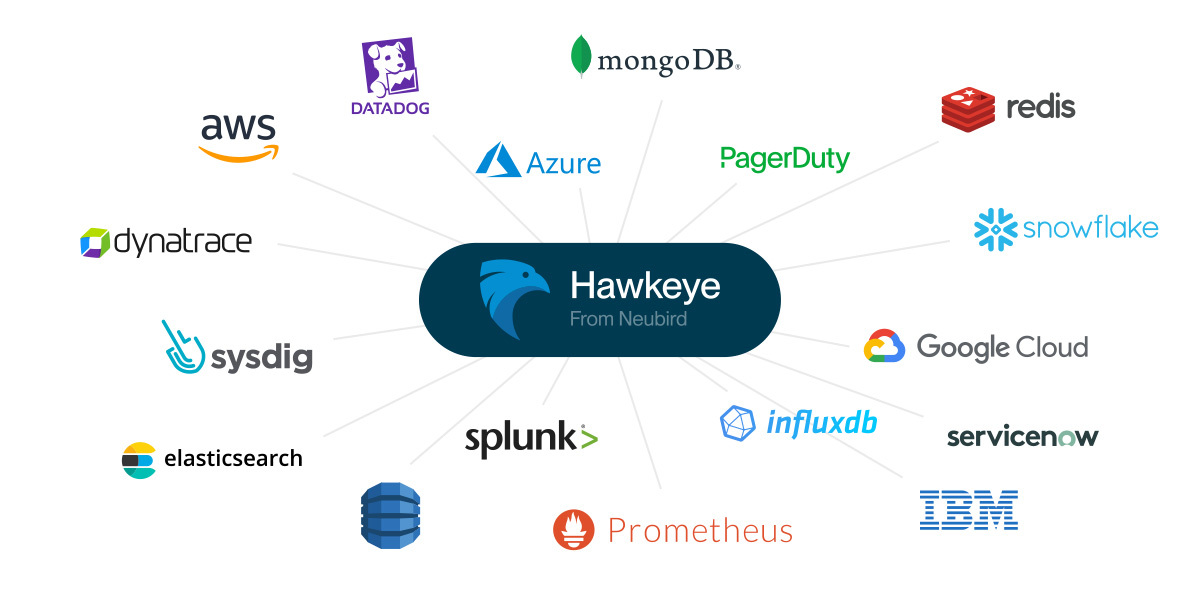
What if we flipped the script on incident response? Instead of engineers manually linking Datadog’s metrics with PagerDuty’s alerts, Neubird acts as a smart connector that seamlessly links these platforms while also using data from your entire observability toolkit. When a Datadog monitor detects an issue and PagerDuty creates an incident, Neubird automatically puts together the full picture.
This approach doesn’t replace your investment in monitoring tools, instead, it boosts the value of your Datadog-PagerDuty integration by providing the contextual intelligence needed to make faster, better decisions.
Beyond Simple Integration: Enhancing the PagerDuty Datadog Integration
When a Datadog monitor triggers a PagerDuty notification, Neubird jumps into action instantly, before the on-call engineer even sees the alert. It immediately connects Datadog metrics, examines recent changes, analyzes logs, and gathers APM trace data.
For example, if a latency spike triggers an alert, Neubird might find a recent code deployment that affected the same service, connect it with unusual database query patterns, and put these findings into a clear assessment.
This process takes seconds, compared to the 20+ minutes an engineer would typically spend logging into platforms, running queries, and linking metrics and incidents. Neubird continuously learns which Datadog metrics are good indicators for specific incidents, understanding the connections between monitoring data and operational events to provide increasingly accurate insights.
Transforming Datadog and PagerDuty Incident Management Workflow
Traditional workflows require engineers to wake up, log into systems, gather context, and come up with a response, all under pressure.
With Neubird, engineers start with a single view of the issue and all the information they need to fix it in one analysis. Routine issues are easily handled with recommended actions, and complex problems include detailed investigation summaries.
This changes the engineer from someone who gathers data to a strategic problem solver.
Traditional Datadog PagerDuty Workflow
- Datadog detects an anomaly and triggers a monitor alert
- PagerDuty creates an incident and notifies the on-call engineer
- Engineer acknowledges the alert in PagerDuty
- Engineer logs into Datadog to investigate the triggering metric
- Engineer manually searches for related metrics, logs, and traces
- Engineer determines the root cause and implements a fix
- Engineer resolves the incident in PagerDuty
This process typically takes 30-60 minutes.
Neubird-Enhanced Workflow
- Datadog detects an anomaly and triggers a monitor alert
- Neubird analyzes Datadog metrics, logs, and traces.
- Neubird connects the incident with historical data from PagerDuty.
- Neubird AI prepares an analysis with recommendations.
- PagerDuty creates an enriched incident with Neubird’s analysis attached.
- Engineer reviews Neubird’s analysis and implements the recommended solution
- Engineer resolves the incident in PagerDuty
This reduces investigation time by 70-80%, allowing your engineers to focus on solutions.
Unlocking Actionable Insights with Effective AI Prompting
To get the most out of an AI SRE teammate like Neubird, it’s important to ask the right questions. For PagerDuty, prompts should help you understand incident response:
- “Who is currently on-call for my critical services?”
- “Are there any incidents at risk of breaching their SLA targets?”
- “What services had the most PagerDuty escalations this month?”
For Datadog monitoring, good Gen AI prompts include:
- “What are the most frequent errors in my application logs?”
- “Which services have high error rates or response times?”
- “Show me hosts with abnormal CPU or memory usage compared to baseline”
These questions help Neubird provide valuable insights. Learn more in our Datadog prompting guide and PagerDuty prompting guide.
The Future of SRE Work: Evolving Beyond Reactive Datadog-PagerDuty Management
As monitoring becomes more complex and alert volumes increase, simply adding more engineers has its limits. SRE talent is scarce, expensive, and hard to keep.
Neubird changes this by intelligently automating routine Datadog PagerDuty workflows, creating a multiplier effect, similar to how it provides intelligent automation for ServiceNow. Your team can manage more services without constantly needing more people, and it addresses burnout by enabling:
- Higher-value work: Engineers shift from repetitive Datadog query writing and alert triaging to meaningful system improvements.
- Improved on-call quality of life: Those middle-of-night PagerDuty alerts become less disruptive as Neubird provides immediate context and clear remediation steps.
- Accelerated knowledge distribution: New team members gain immediate access to Neubird’s institutional knowledge about your environment’s Datadog metrics and PagerDuty incident patterns, dramatically shortening ramp-up time and reducing the ‘expertise bottleneck’ common in SRE teams.
The impact on your business is significant: reduced recruitment costs, better employee retention, and the ability to scale operations more efficiently.
Getting Started
Implementing Neubird alongside your existing tools is a straightforward process that begins paying dividends immediately. While this blog focuses on Datadog and PagerDuty, Neubird’s integrations help you can connect it to your entire observability stack, creating a unified intelligence layer across all your tools.
Read more:
- See how you can enhance your Splunk and PagerDuty integration
- or power-up your Datadog and ServiceNow SRE workflows
Take the Next Step
Adding Neubird AI is easy. Set up secure, read-only connections to Datadog and PagerDuty.
Ready to transform your operations? Check our demo or contact us to see how Neubird can become your team’s AI-powered SRE teammate.
Related Reading
- 2026 State of AI SRE Terminology – full AI SRE terminology reference
Written by

Francois Martel
Field CTO
Frequently Asked Questions
Datadog and PagerDuty serve complementary functions in your observability and incident response ecosystem. The integration of these tools creates a complete observability and incident management workflow. Datadog detects issues and generates alerts, while PagerDuty ensures those alerts reach the right people and facilitates the incident resolution process.
Datadog focuses on monitoring and observability:
- Collecting metrics, logs, and traces
- Visualizing performance data through dashboards
- Detecting anomalies and generating alerts
PagerDuty specializes in incident response management:
- Routing alerts to appropriate responders
- Managing on-call schedules and escalations
- Coordinating response activities
- Tracking incident resolution
Related Articles
Top 20 AI SRE Tools in 2026: The Complete Guide
Quick take: The AI SRE market splits into three tiers: legacy observability platforms with bolted-on AI, AIOps tools that correlate…

We Were Drowning in Alerts. Falcon Threw Us a Lifeline.
How a small engineering team stopped drowning in alerts and started running production with confidence. I lead engineering at a…
