Transforming Splunk and PagerDuty Integration and Workflows with GenAI: Stop Solving Wrong Problems
“Just tune your alert thresholds better.” “Set up more sophisticated routing rules.” “Create better runbooks.”
If you’re an SRE dealing with alert fatigue, you’ve heard these suggestions before. Yet despite years of refinement, most teams still face a fundamental challenge: the volume and complexity of alerts continue to outpace our ability to handle them effectively. Traditional approaches to alert management are hitting their limits—not because they’re poorly implemented, but because they’re solving the wrong problem.
The issue isn’t just about routing alerts more efficiently or documenting better runbooks. It’s about the fundamental way we approach incident response. When a critical Splunk alert triggers a PagerDuty notification at 3 AM, the real problem isn’t the alert itself—it’s that a human has to wake up and spend precious time gathering context, analyzing logs, and determining the right course of action.
Beyond Alert Automation: The Current Reality
Today’s incident response stack is sophisticated. Splunk’s machine learning capabilities can detect anomalies in real-time, while PagerDuty’s intelligent routing ensures alerts reach the right people. Yet the reality in most enterprises is far more complex. Different teams often prefer different tools, leading to scenarios where application logs might live in Splunk, while cloud metrics flow to CloudWatch, and APM data resides in Datadog.
This fragmentation means that when an alert fires, engineers must:
- Acknowledge the PagerDuty notification
- Log into multiple systems
- Write and refine Splunk queries
- Correlate data across platforms
- Document findings
- Implement solutions
All while the clock is ticking and services might be degraded.
The Standard Integration Methods: Common Splunk & PagerDuty Approaches
Splunk Webhook to PagerDuty
Splunk triggers real-time alerts to PagerDuty via webhooks by configuring an alert action to send payloads to the PagerDuty Events API using an integration key. Setting it up is straightforward, but mapping detailed Splunk data (e.g., log context) to PagerDuty’s limited incident fields can be clunky, often requiring manual tweaks. Combining Splunk’s rich telemetry with PagerDuty’s escalation creates a reactive feedback loop, though it lacks the insights SRE teams need.
PagerDuty Events API Integration
Splunk leverages PagerDuty’s Events API to push customized event data—severity, source, or metrics—via scripted REST calls, enabling dynamic incident management. The difficulty lies in scripting complexity and error handling, as API rate limits or malformed payloads can disrupt workflows, demanding ongoing maintenance. This integration merges Splunk’s diagnostics with PagerDuty’s response orchestration, offering deeper incident context than standalone tools.
PagerDuty Data Ingestion into Splunk
Splunk pulls PagerDuty incident logs via the PagerDuty Add-on or REST inputs, enabling correlation with system metrics and logs for after-the-fact analysis. The challenge is managing data volume and latency—API polling can lag, and parsing unstructured incident data into Splunk’s schema takes effort. This method fuses PagerDuty’s operational history with Splunk’s analytics, providing a fuller picture of incidents.
Splunk Alert Action with PagerDuty App
The PagerDuty App for Splunk embeds an alert action to route Splunk alerts to PagerDuty services, auto-creating incidents with links back to Splunk after a simple key-based setup. While user-friendly, it struggles with customization—teams often hit limits when trying to enrich incidents beyond basic fields, requiring workarounds.
Third-Party Middleware (e.g., AWS Lambda)
A middleware like AWS Lambda processes Splunk alerts and pushes them to PagerDuty with tailored logic, bridging the two platforms flexibly. Setup is complex—teams must handle Lambda coding, security, and potential delays, making it resource-intensive. Combining data this way offers granular control and richer insights, but it’s still a manual bridge.
Hitting the Limits: Challenges with Conventional PagerDuty Splunk Integrations
Even with standard integrations in place, organizations run into issues.
Fragmented Data and Context
Basic integrations often result in siloed information, forcing engineers to manually correlate logs with alerts across multiple platforms.
Static and Rigid Workflows
Predefined rules in global event routing or direct integrations can struggle with dynamic environments, leading to misrouted alerts or delayed responses.
High Maintenance Overhead
Legacy integrations and custom scripts require continuous updates to adapt to changing IT landscapes, consuming valuable time and resources.
Limited Intelligence
Traditional setups lack the capability to analyze historical data or generate actionable insights, leaving SREs with a fragmented picture that delays effective resolution.
Meet Hawkeye: Bridging the Gap with Generative AI for Splunk ServiceNow Integration
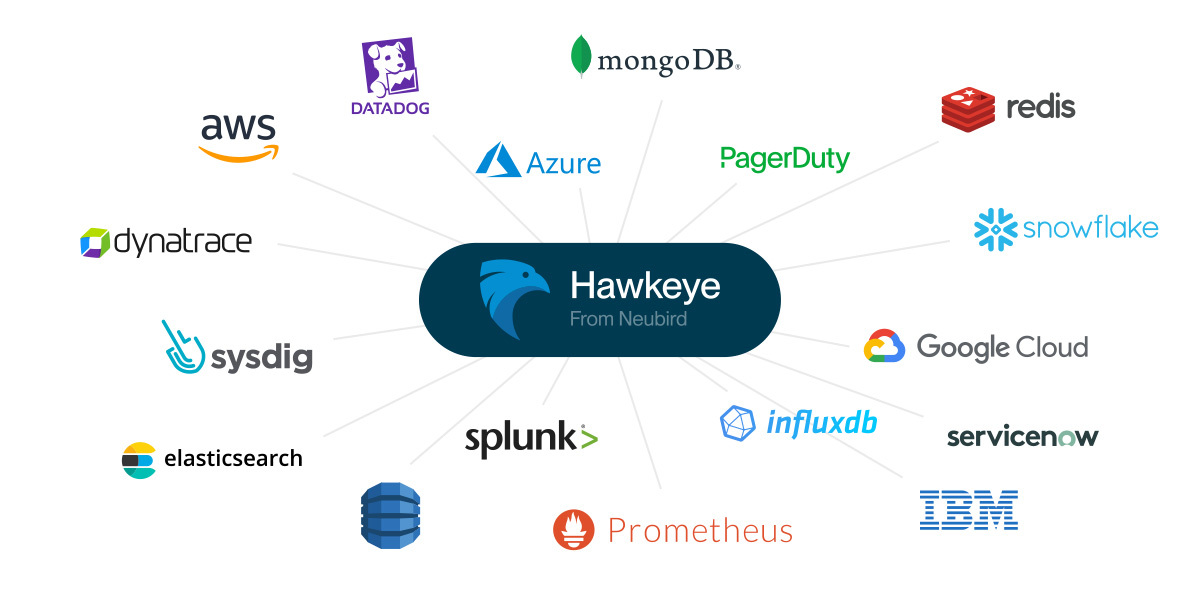
Consider a fundamentally different approach. Instead of humans serving as the integration layer between tools, Hawkeye acts as an intelligent orchestrator that not only bridges Splunk and PagerDuty but can pull relevant information from your entire observability ecosystem. This isn’t about replacing any of your existing tools—it’s about having a GenAI powered SRE that maximizes their collective value and helps your team deliver results and scale.
Beyond Simple Integration: How Hawkeye Improves PagerDuty and Splunk
When a critical alert fires, Hawkeye springs into action before any human is notified. It automatically:
- Analyzes Splunk logs using sophisticated SPL queries
- Correlates patterns across different time periods
- Gathers context from other observability tools
- Prepares a comprehensive incident analysis
- Recommends specific actions based on historical success patterns
This happens in seconds, not the minutes or hours it would take a human engineer to manually perform these steps. More importantly, Hawkeye learns from each incident, continuously improving its ability to identify root causes and recommend effective solutions.
Transforming Splunk and PagerDuty Incident Management and Response Workflow
The transformation in daily operations is profound. Instead of starting their investigation from scratch when a PagerDuty alert comes in, engineers receive a complete context package from Hawkeye, including:
- Relevant log patterns identified in Splunk
- Historical context from similar incidents
- Correlation with other system metrics
- Specific recommendations for resolution
This shifts the engineer’s role from data gatherer to strategic problem solver, focusing their expertise where it matters most.
Unlocking Actionable Insights with Effective AI Prompting for Splunk and PagerDuty
“Talking” to an AI SRE teammate like Hawkeye requires asking and prompting the right questions. In a PagerDuty environment, consider AI prompts that help you understand incident response dynamics:
You might prompt GenAI “Which incidents are at risk of breaching their SLA targets?” or “Who is currently on-call for my critical services?”. Similarly, for your PagerDuty escalation management, think about optimizing alert workflows or balancing on-call rotations, all of which are crucial for maintaining operational efficiency. Learn more in our PagerDuty prompting guide.
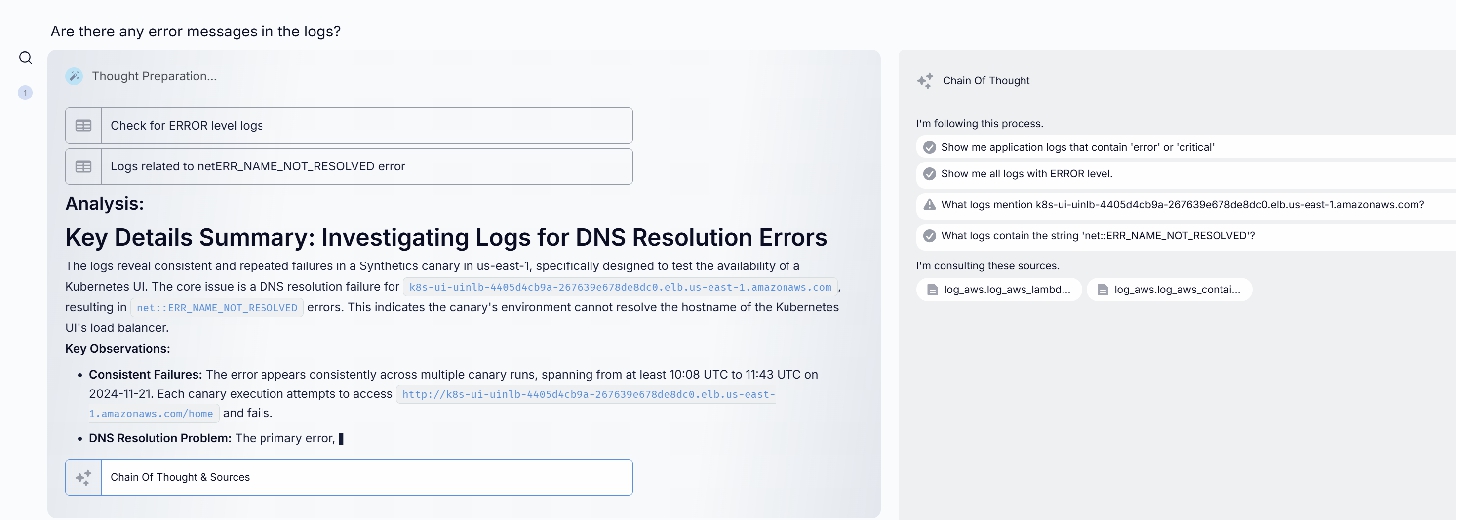
On the Splunk side, the focus shifts to data-driven insights. Prompts like “What are the most common error types in the last 7 days?” or “Which searches are consuming the most resources?” give you a deeper understanding of your log patterns to identify anomalies. Learn more in our Splunk prompting guide.
The Future of SRE Work: From Survival to Strategic Impact
The transformation Hawkeye brings to SRE teams extends far beyond technical efficiency. Hawkeye automates routine investigations and provides intelligent analysis across your observability stack, multiplying the capacity of your existing team, meaning you can handle growing system complexity without proportionally growing headcount. More importantly, it transforms the SRE role itself, addressing many of the factors that drive burnout and turnover:
- Engineers spend more time on intellectually engaging work like architectural improvements and capacity planning, rather than repetitive investigations.
- The dreaded 3 AM wake-up calls become increasingly rare as Hawkeye handles routine issues.
- New team members come up to speed faster, learning from Hawkeye’s accumulated knowledge base.
For organizations, this translates directly to the bottom line through reduced recruitment costs, higher retention rates, and the ability to scale operations without scaling headcount.
Real Impact, Real Results
Early adopters of this approach are seeing dramatic improvements:
- Reduction in mean time to resolution
- Fewer escalations to senior engineers
- More time for strategic initiatives
- Improved team morale and retention
- Better documentation and knowledge sharing
How to Begin
Implementing Hawkeye alongside your existing tools is a straightforward process that begins paying dividends immediately. While this blog focuses on Splunk and PagerDuty, Hawkeye’s integration capabilities mean you can connect it to your entire observability stack, creating a unified intelligence layer across all your tools.
Read more:
- See how you can transform your Datadog & PagerDuty Workflows
- or power-up your Splunk and ServiceNow SRE workflows
Take the Next Step
Adding Hawkeye into your observability stack is easy:
- Set up read-only connections to Splunk and PagerDuty.
- Start a project within Hawkeye, linking your data sources.
- Start interactive investigations, using real-time insights.
Ready to experience the power of GenAI for your incident management workflows? Check our demo or contact us to see how Hawkeye can become your team’s AI-powered SRE teammate.
FAQ
What is Splunk used for?
Splunk excels at capturing, indexing, and correlating machine-generated data – logs, metrics, traces – turning raw information into valuable insights. It’s a powerhouse for:
- Security Information and Event Management: Detecting and responding to security threats.
- IT Operations Management: Monitoring infrastructure and application performance.
- Business Analytics: Uncovering trends and patterns to drive better decision-making.
What is PagerDuty used for?
PagerDuty delivers enterprise-grade incident management capabilities, enabling organizations to orchestrate the ideal response to any operational disruption. It provides:
Incident Response Automation: Streamlining resolution workflows to minimize service impact.
Strategic On-call Management: Implementing intelligent scheduling to maintain team effectiveness.
Service Level Monitoring: Ensuring consistent adherence to performance objectives across digital services.
Learn more.
What is the difference between Splunk and PagerDuty? Should I use PagerDuty vs Splunk?
While both tools are crucial for incident management, they serve different primary functions. PagerDuty excels in incident response and on-call management, offering features like smart automation for alert grouping and routing. Splunk, on the other hand, focuses on data analytics and log management, providing advanced capabilities in anomaly detection and predictive analytics.
Written by

Francois Martel
Field CTO
Related Articles
Building Guardrails Against Hallucinations in AI SRE Agents
Using MCP With Cursor to Automate Incident Resolution
